

The Microcap Minute Global #1

Hello Friends,
Welcome to this week’s edition of The Microcap Minute Global: US Markets, in a Microcap Minute. Every edition, we first look at the Sector RRG Charts, then shortlist companies from the sectors we like, before looking at the fundamentals of each of them.
Before I begin, a special mention to Mr Julius de Kempenaer, the creator of Relative Rotation Graphs (RRGs). Developed in 2004–05, RRGs provided a remarkably intuitive way to visualize relative strength and momentum across groups of securities and, importantly, how those relationships change over time. The methodology first appeared on Bloomberg Professional Services in 2011 and was later introduced on StockCharts. Much of the framework I use in my RRG Analysis is what I have learnt from his public works.
Also, a special mention to Mr Kris Gunnars, Founder and CEO of StockAnalysis.com. Without his support, the Microcap Minute Global would not have become a reality.
Quick Heads up, Every chart and table below is full resolution, so click any of them to open it larger.
So, let’s begin.
1. The US sector map
Every week I read a Relative Rotation Graph, using charts courtesy of StockCharts.com, of the eleven US sector funds against the S&P 500. On every ticker I look for a long tail. Trajectory matters more than position, so I favour names moving north east, in Leading or Improving.
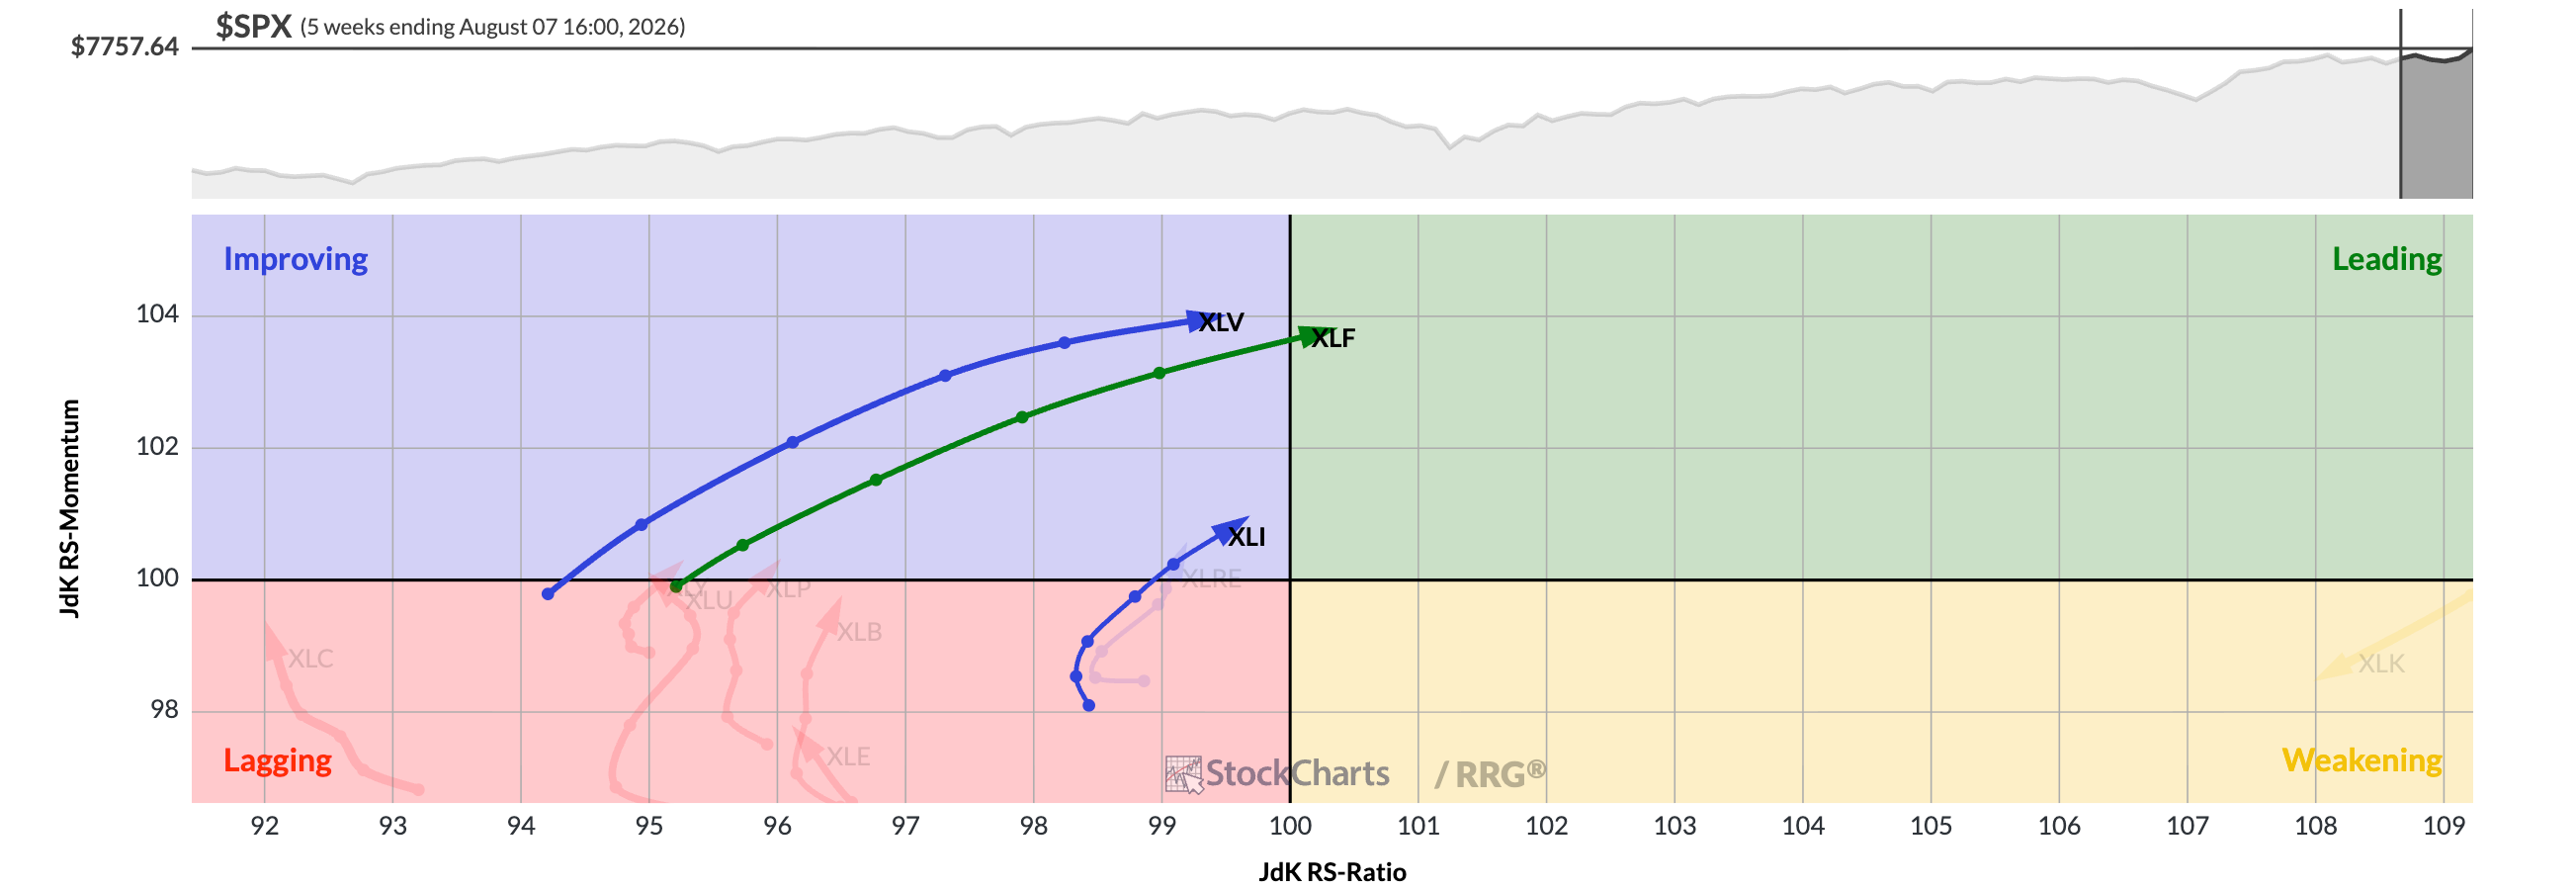
Chart courtesy of StockCharts.com
Three sectors are followed this week: Health Care, Financials and Industrials.

Data courtesy StockAnalysis.com
──

2. The industry funds
Below the sectors sit industries: narrower funds that hold one line of business. I read the same graph across all thirty two of them, the same way, using charts courtesy of StockCharts.com, and note the ones turning up against the index.
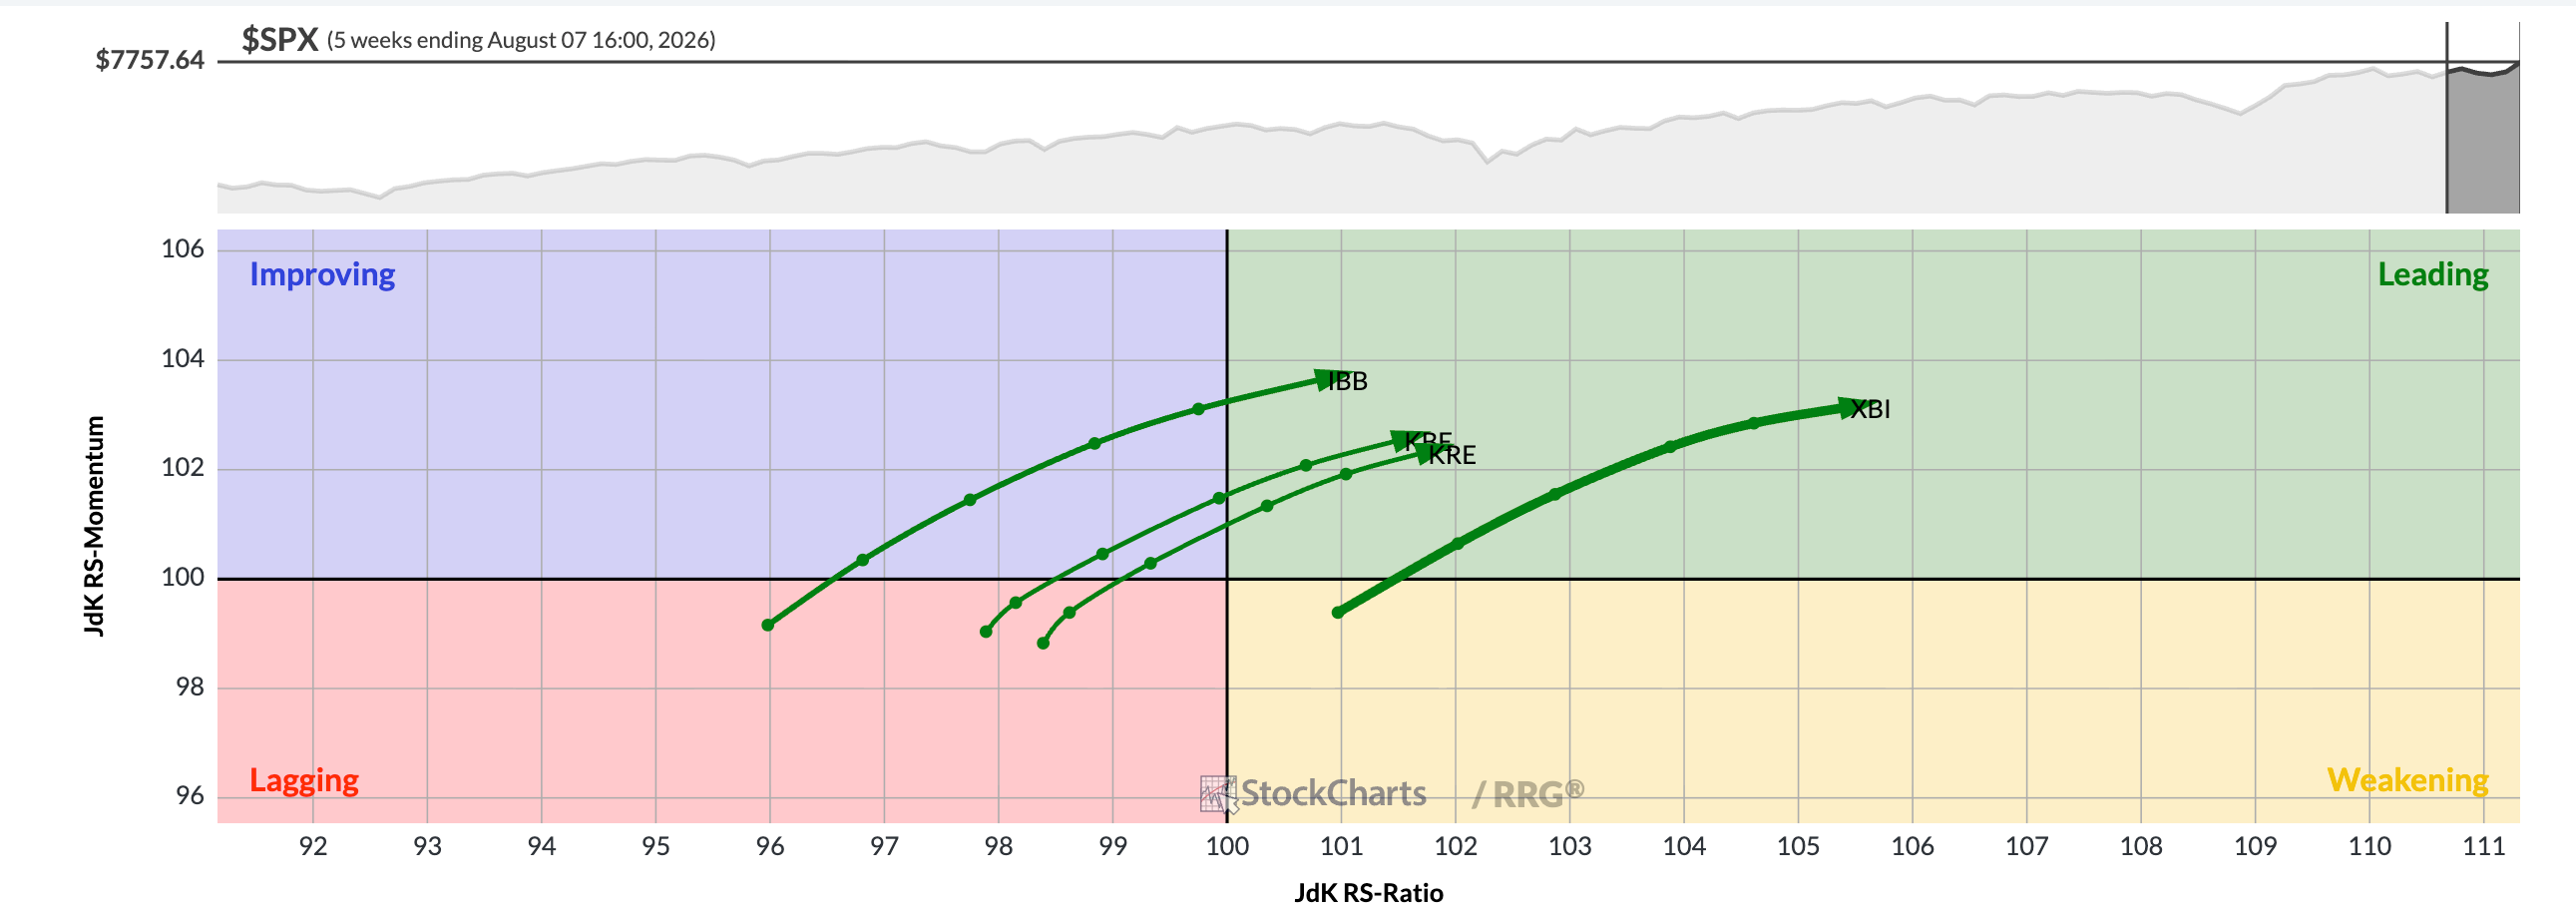
Chart courtesy of StockCharts.com
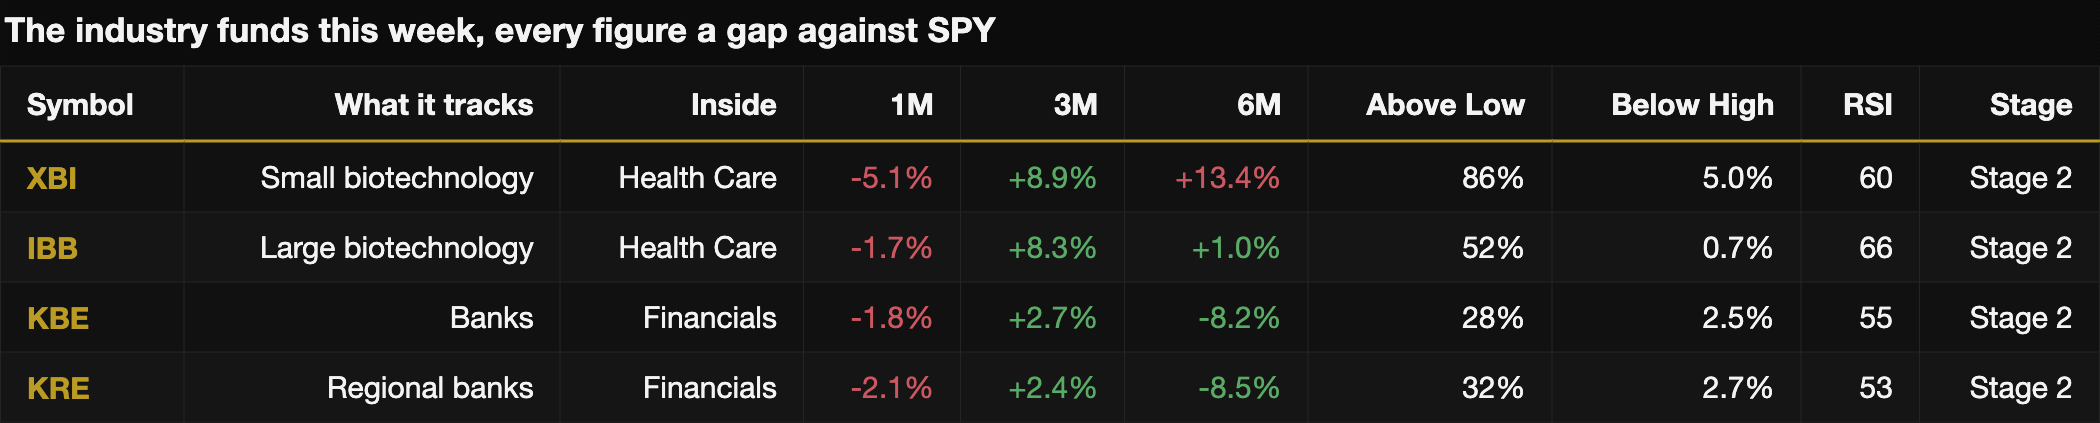
Those are then put through the same tests as the companies further down, and the four that came through are shown. A fund is judged on its own record, not on whether the sector containing it is on the list above, because a line of business can gain ground while the sector around it loses it. The sector each one sits inside is named beside it, so it is clear when the two disagree.
Data courtesy StockAnalysis.com
──
3. The companies
Inside each of those sectors I do the same again, using charts courtesy of StockCharts.com, on the companies themselves, and manually went through some 64 names on the RRG charts.
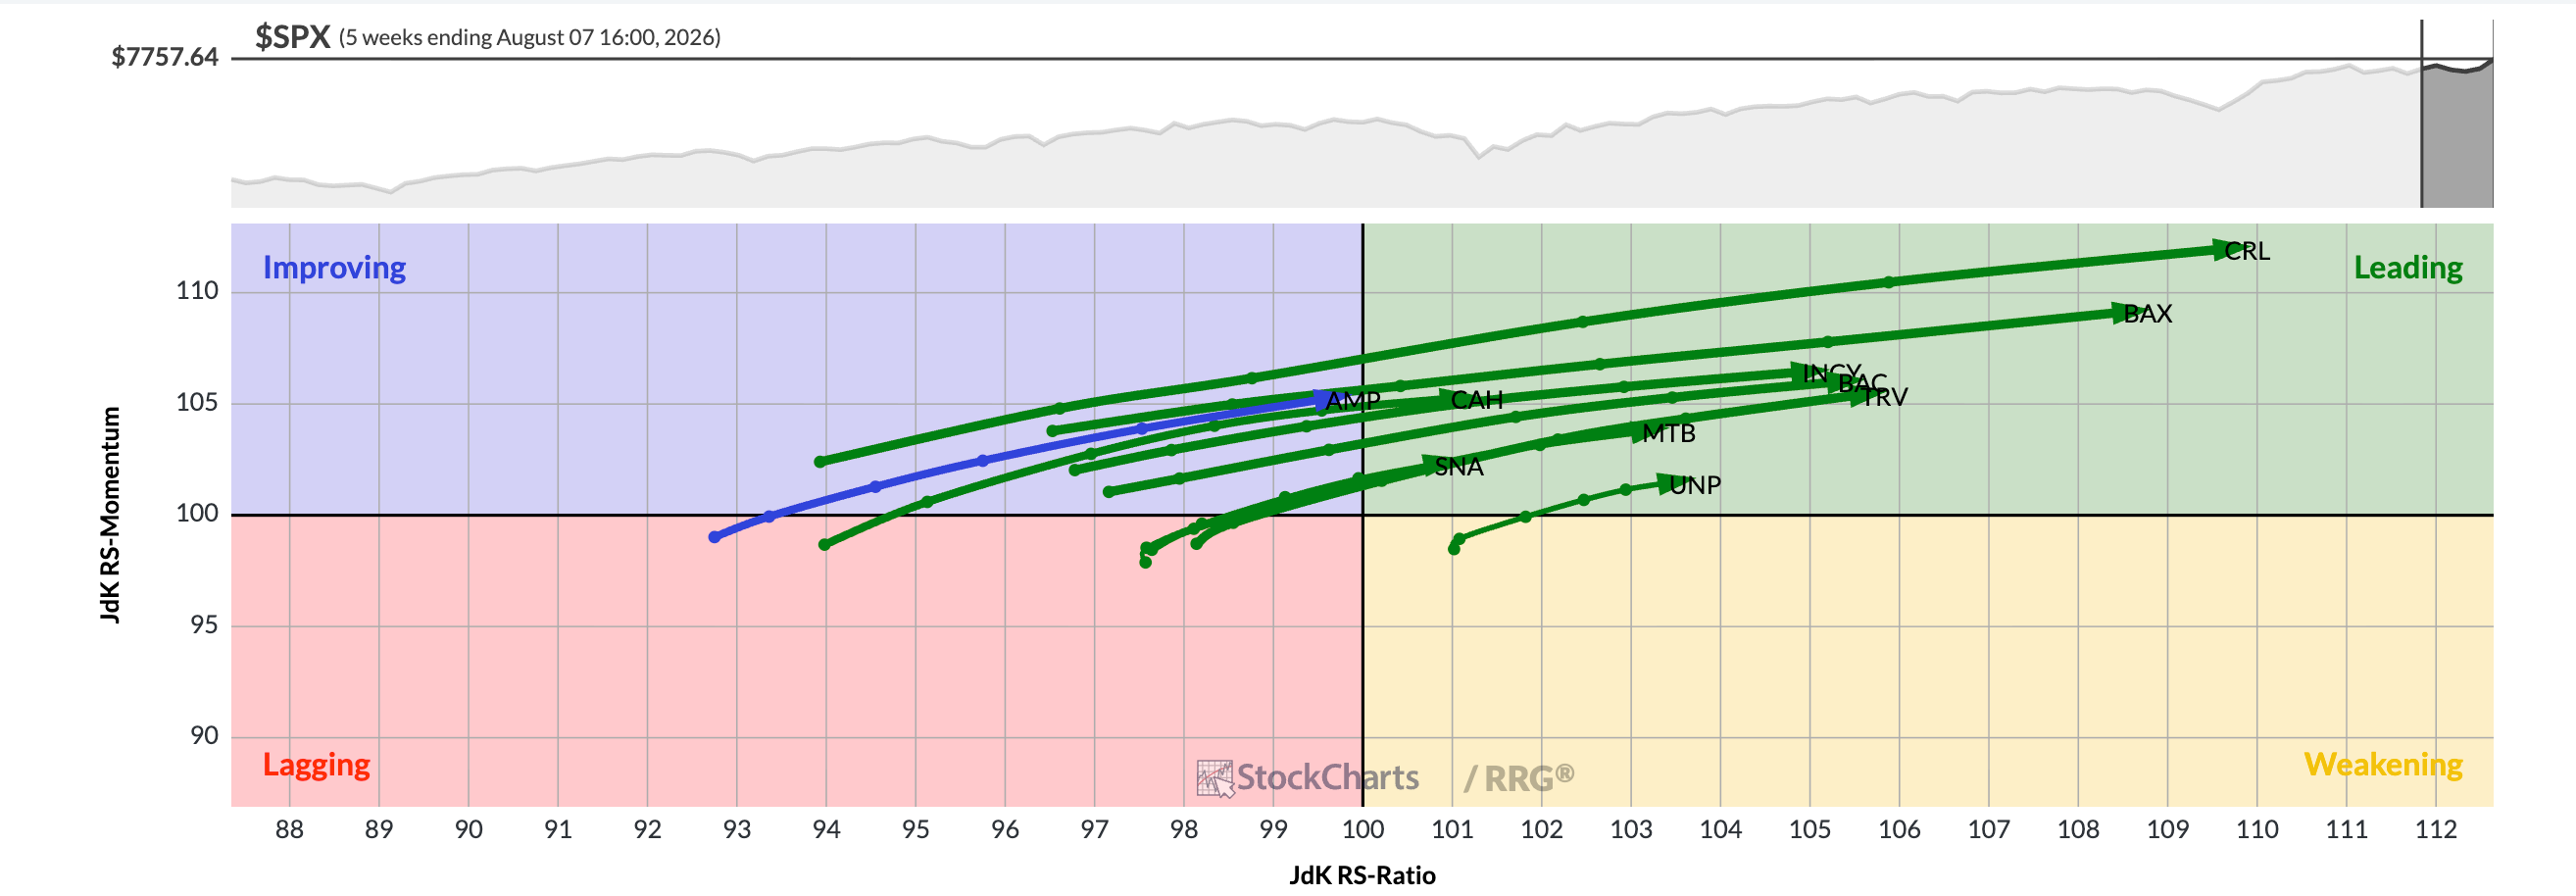
Chart courtesy of StockCharts.com
Those names are then sorted again into the businesses they are actually in, and I keep the strongest of each.
I test to see where price is above the 50 day average, the 50 day above the 150, the 150 above the 200, weekly and monthly RSI above 50, at least 25% above the one year low, within 15% of the one year high, ahead of SPY over three months, and at least $10m of stock changing hands a day.
This week, ten names made the cut.
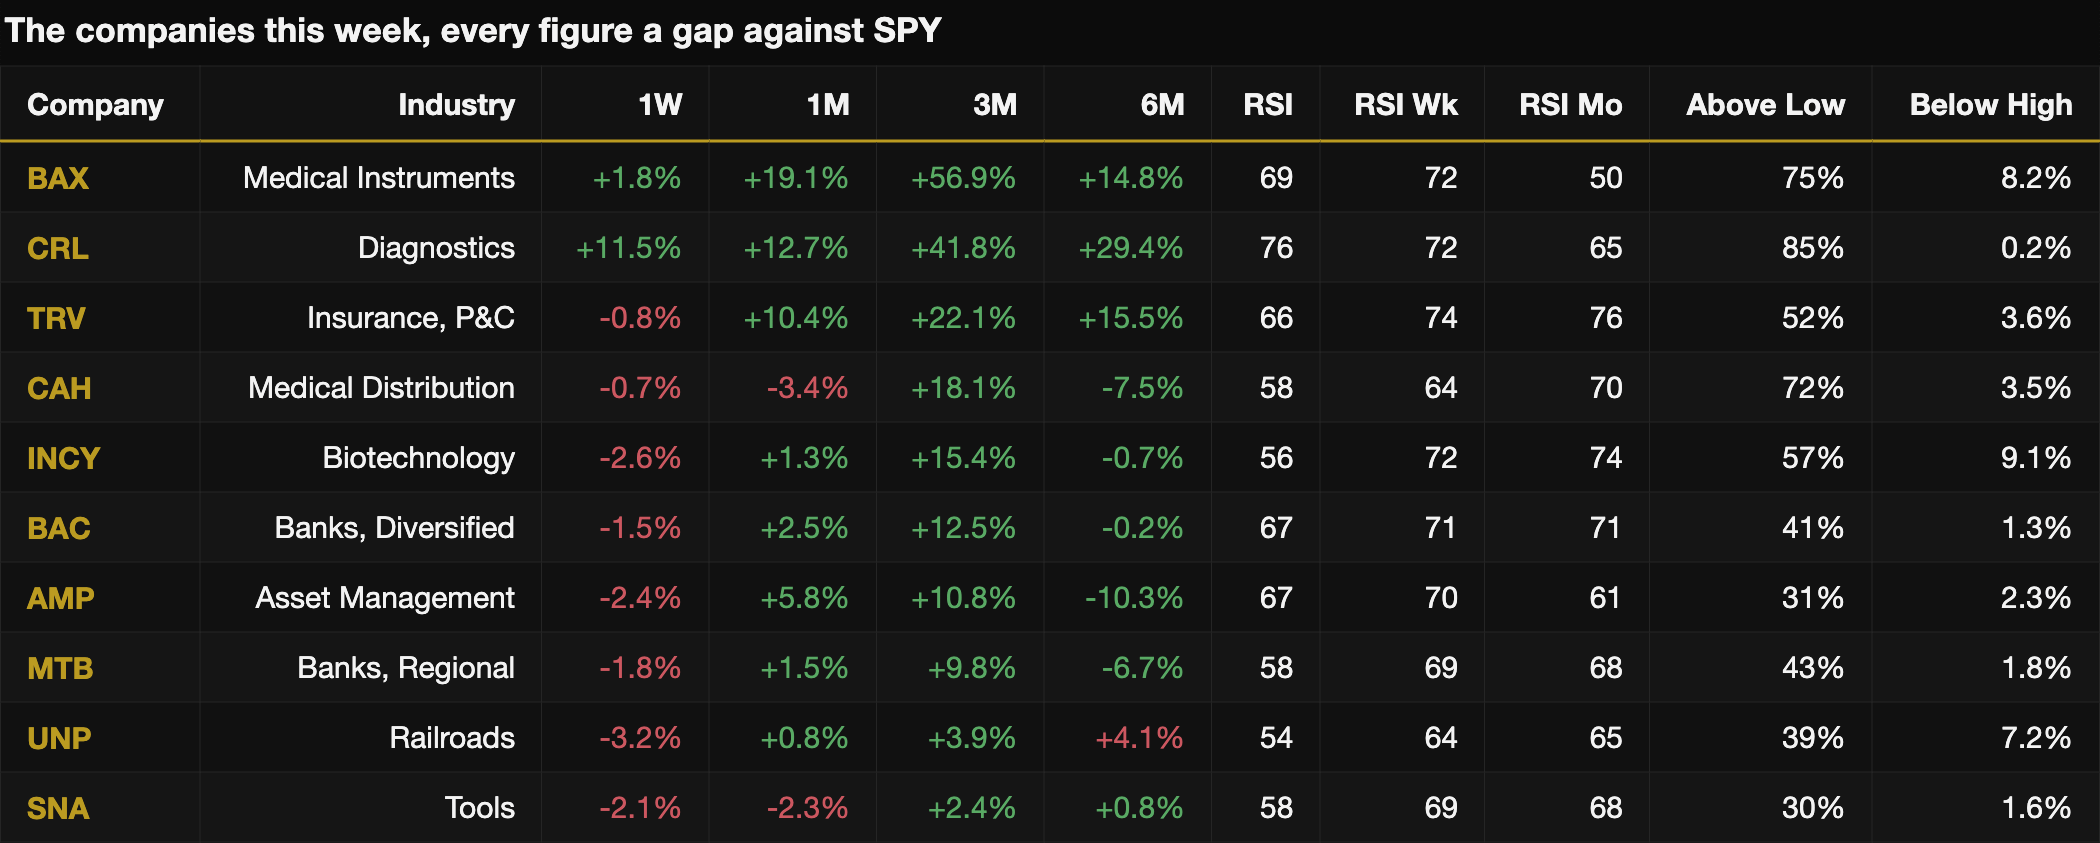
Data courtesy StockAnalysis.com
I then further see if the companies are Stage 2 companies, which in Weinstein’s four stages means a chart in an advance rather than a base, a top or a decline.
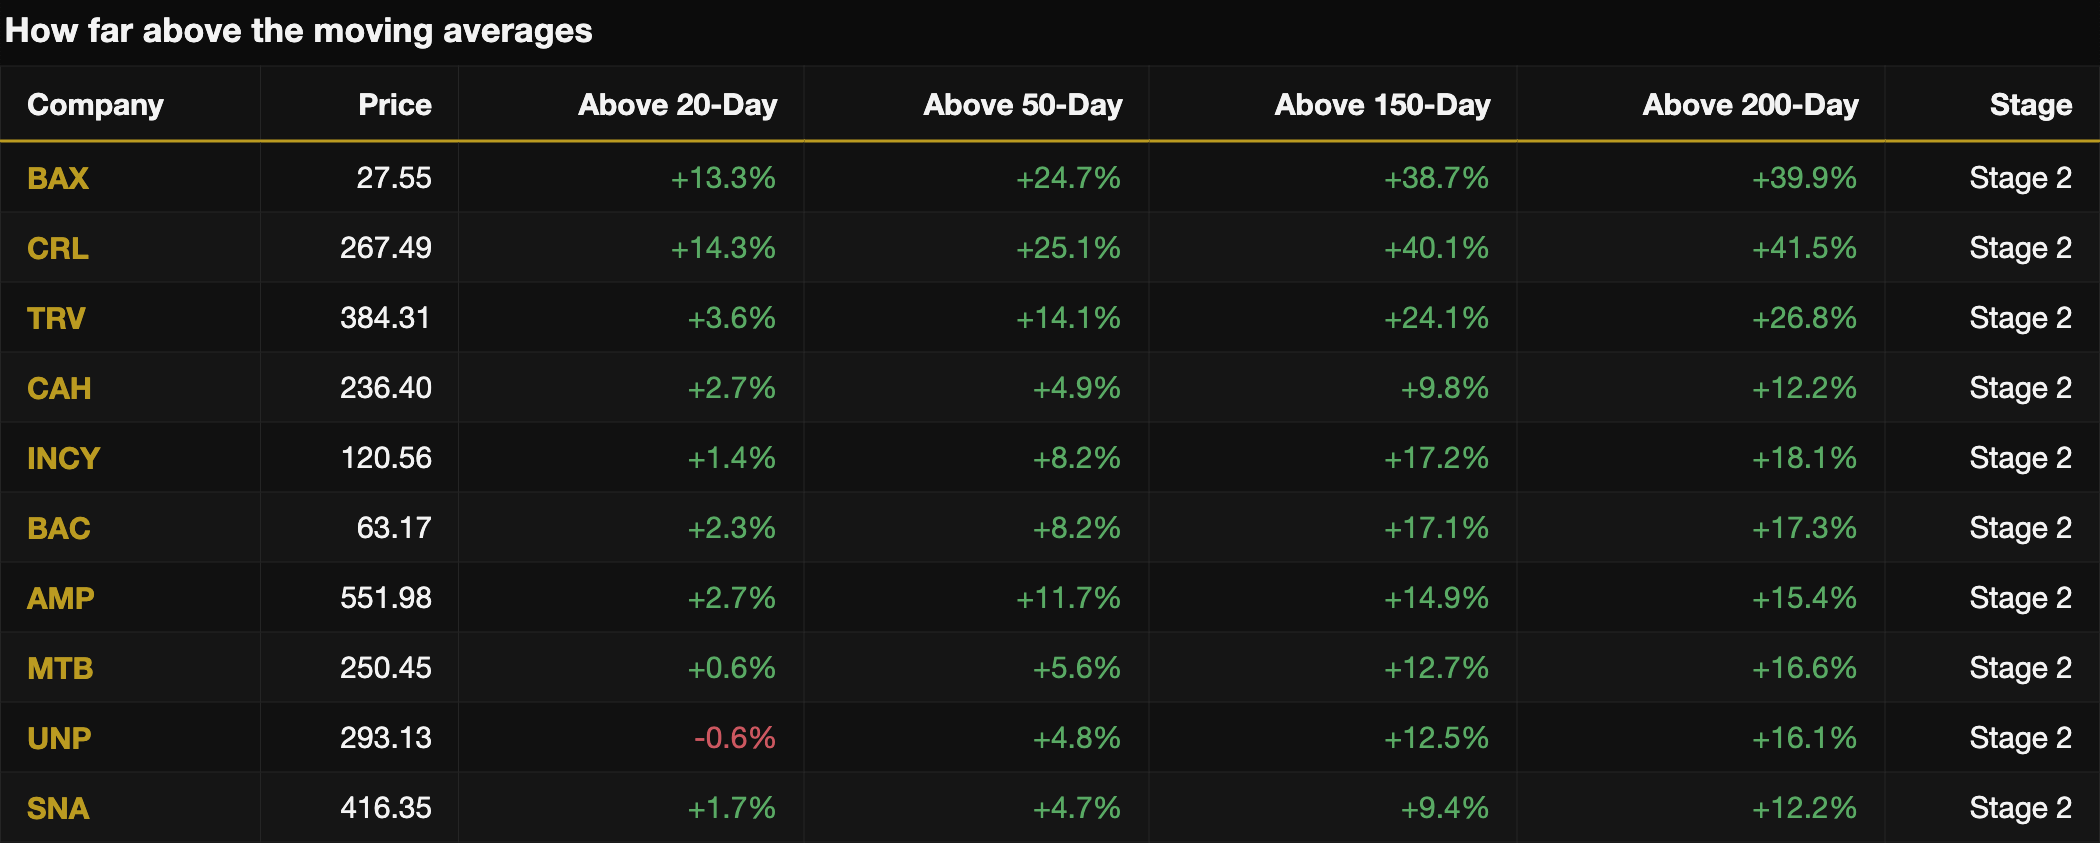
Data courtesy StockAnalysis.com
──
4. The numbers behind them
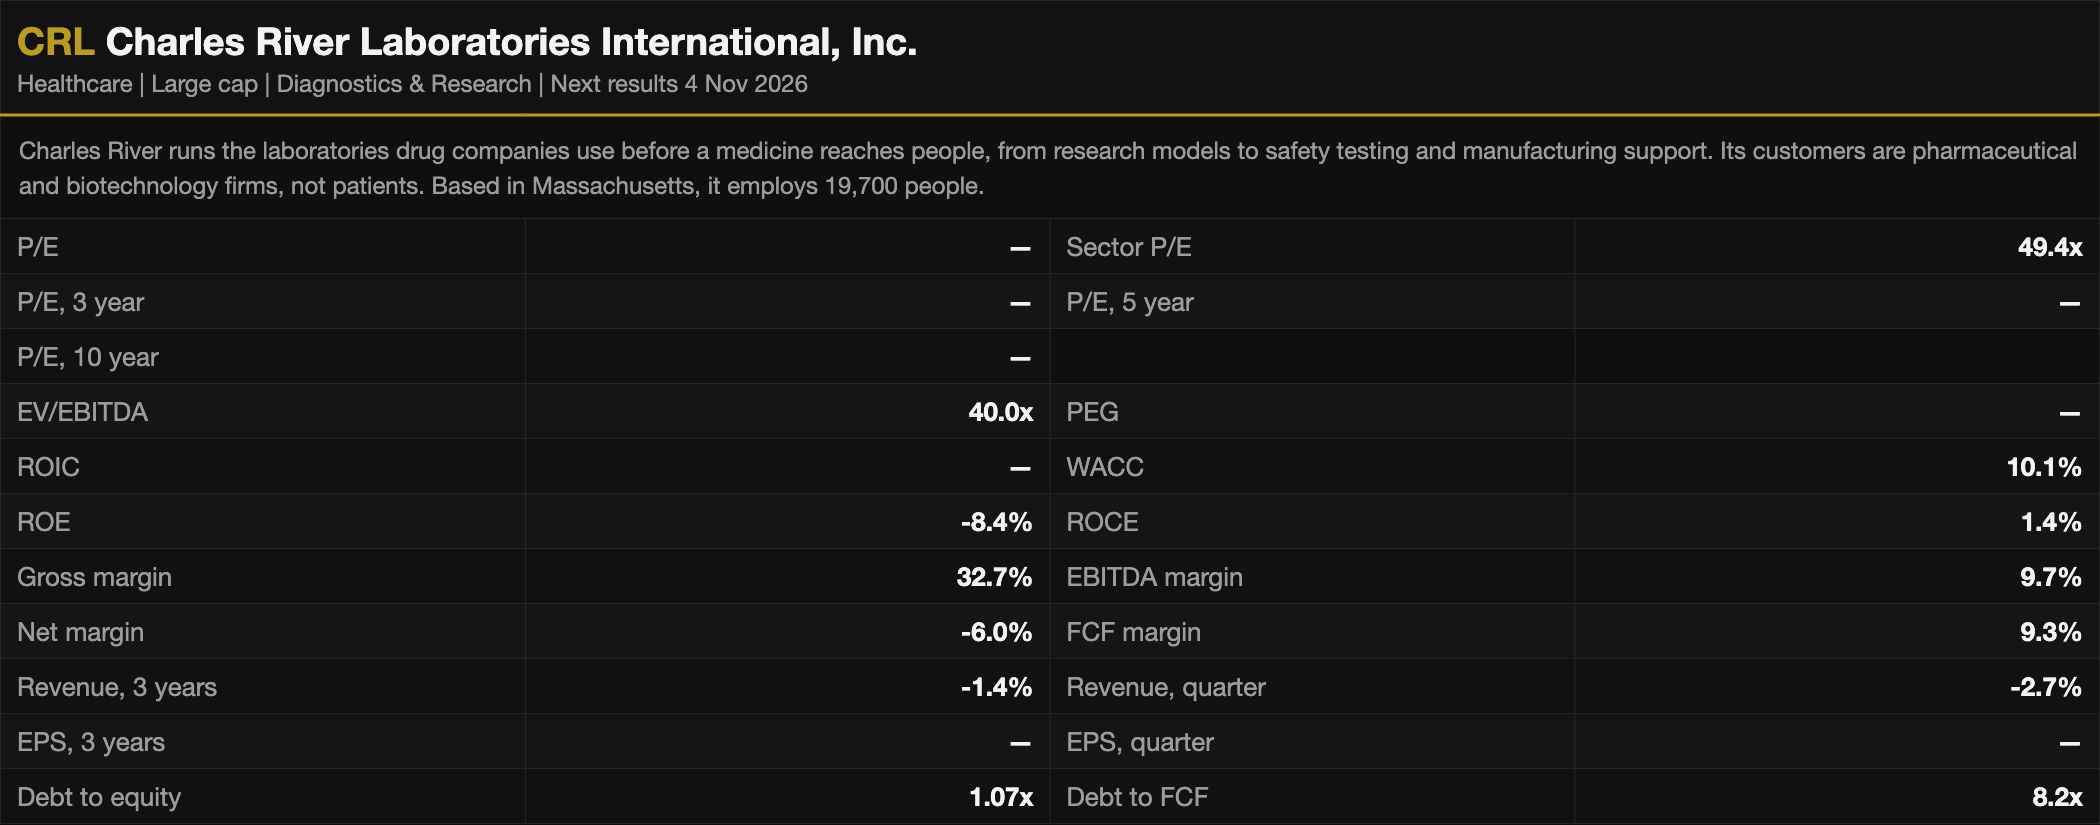
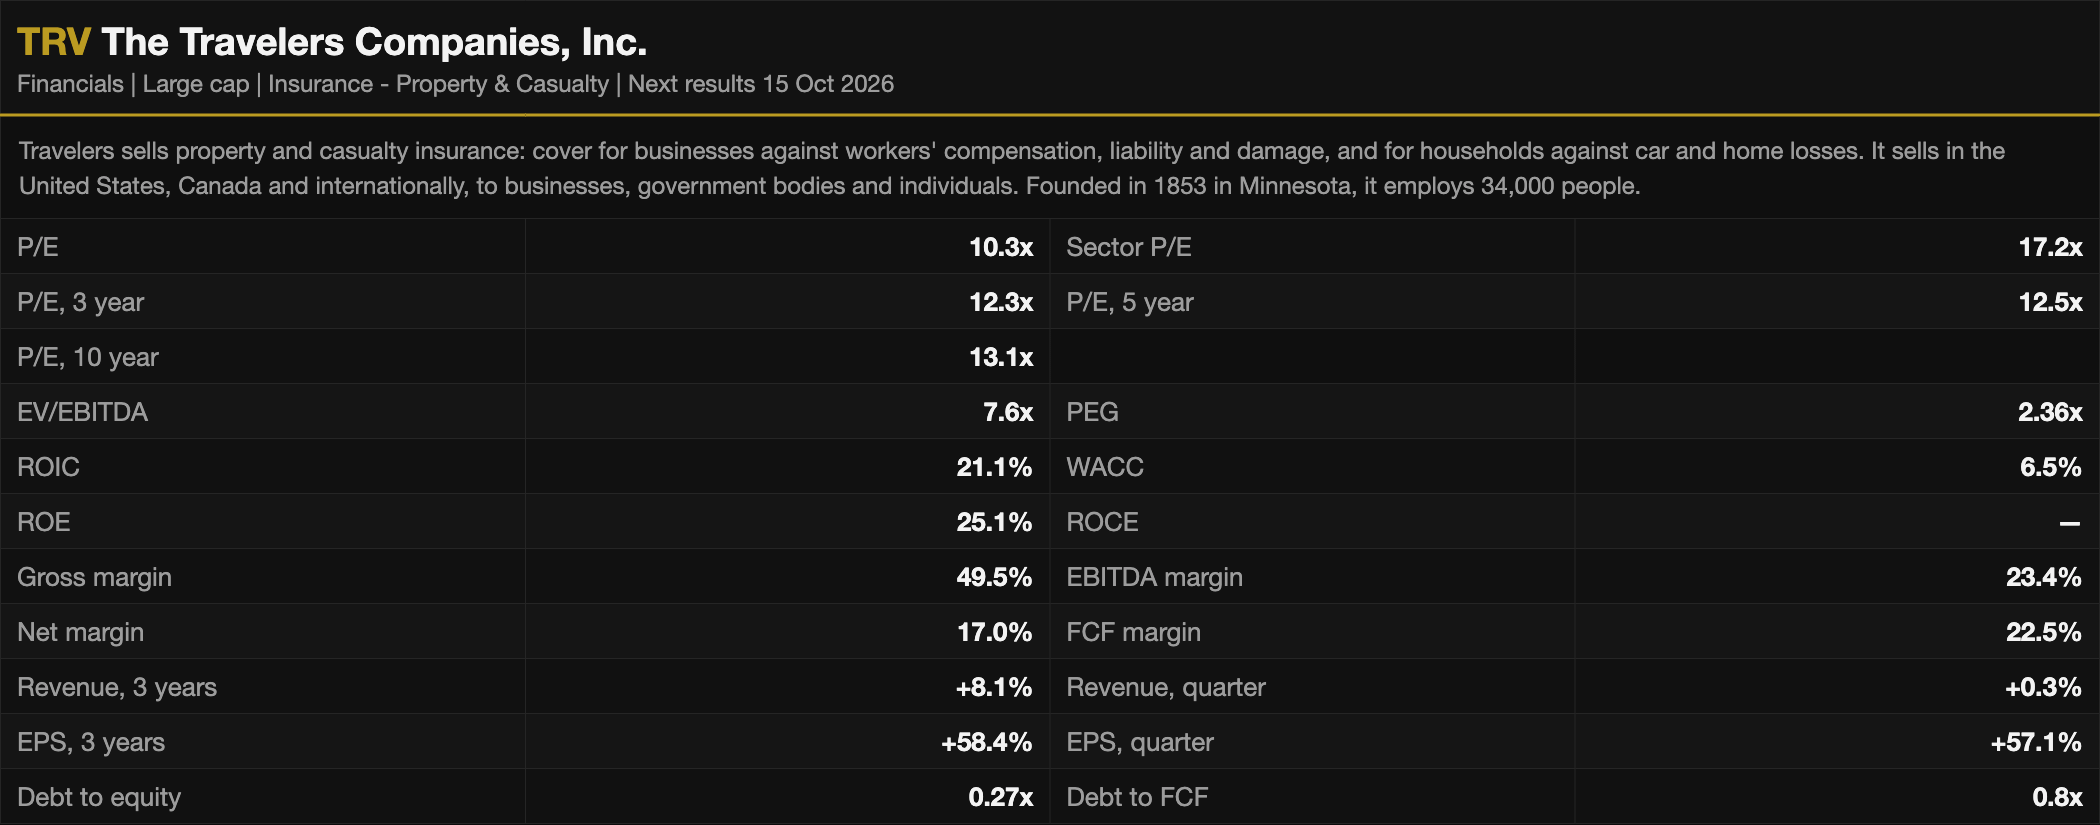
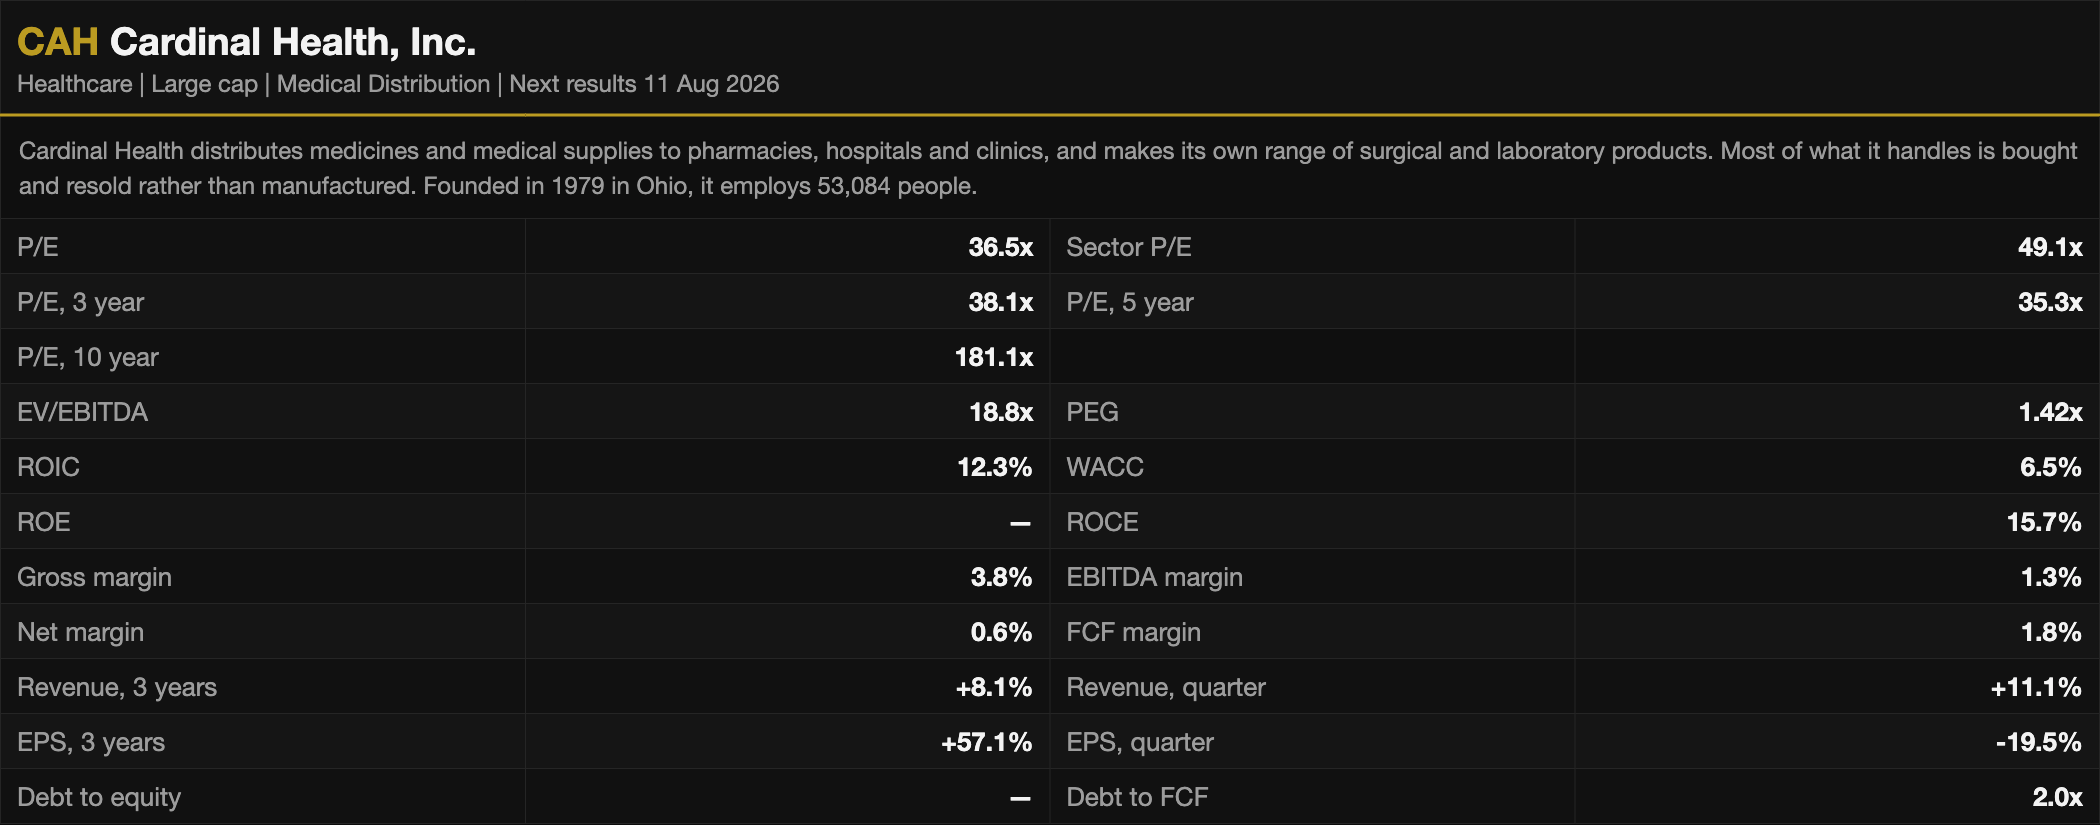
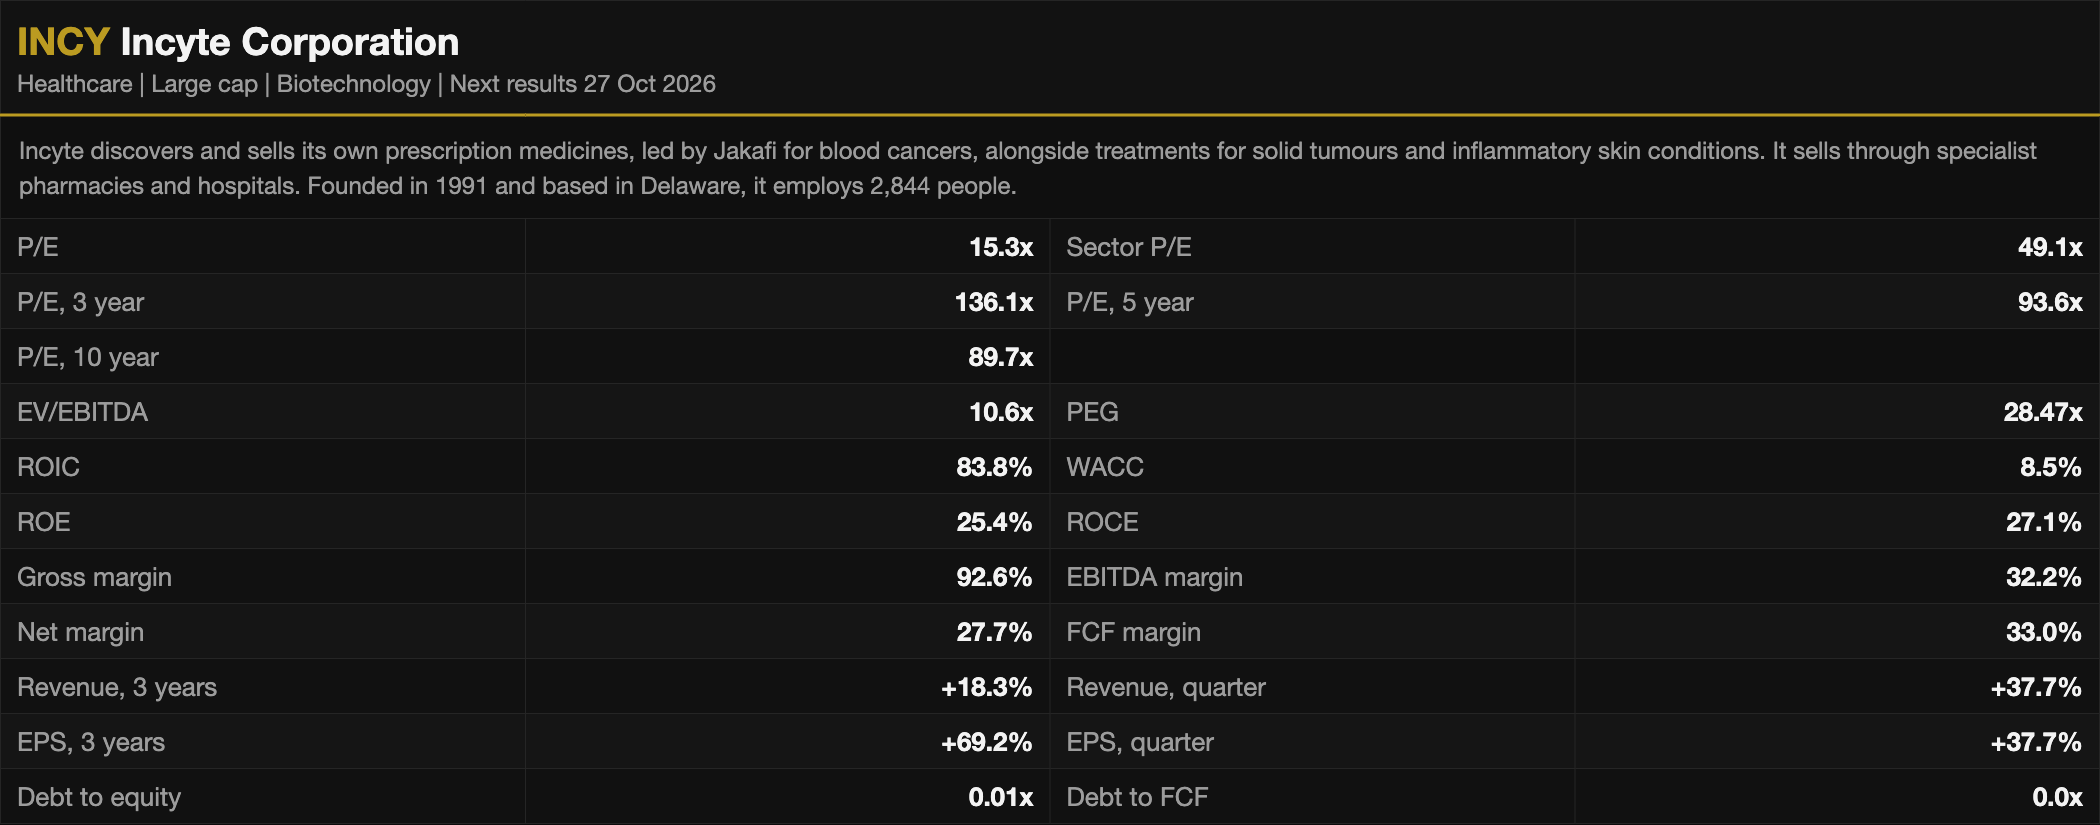
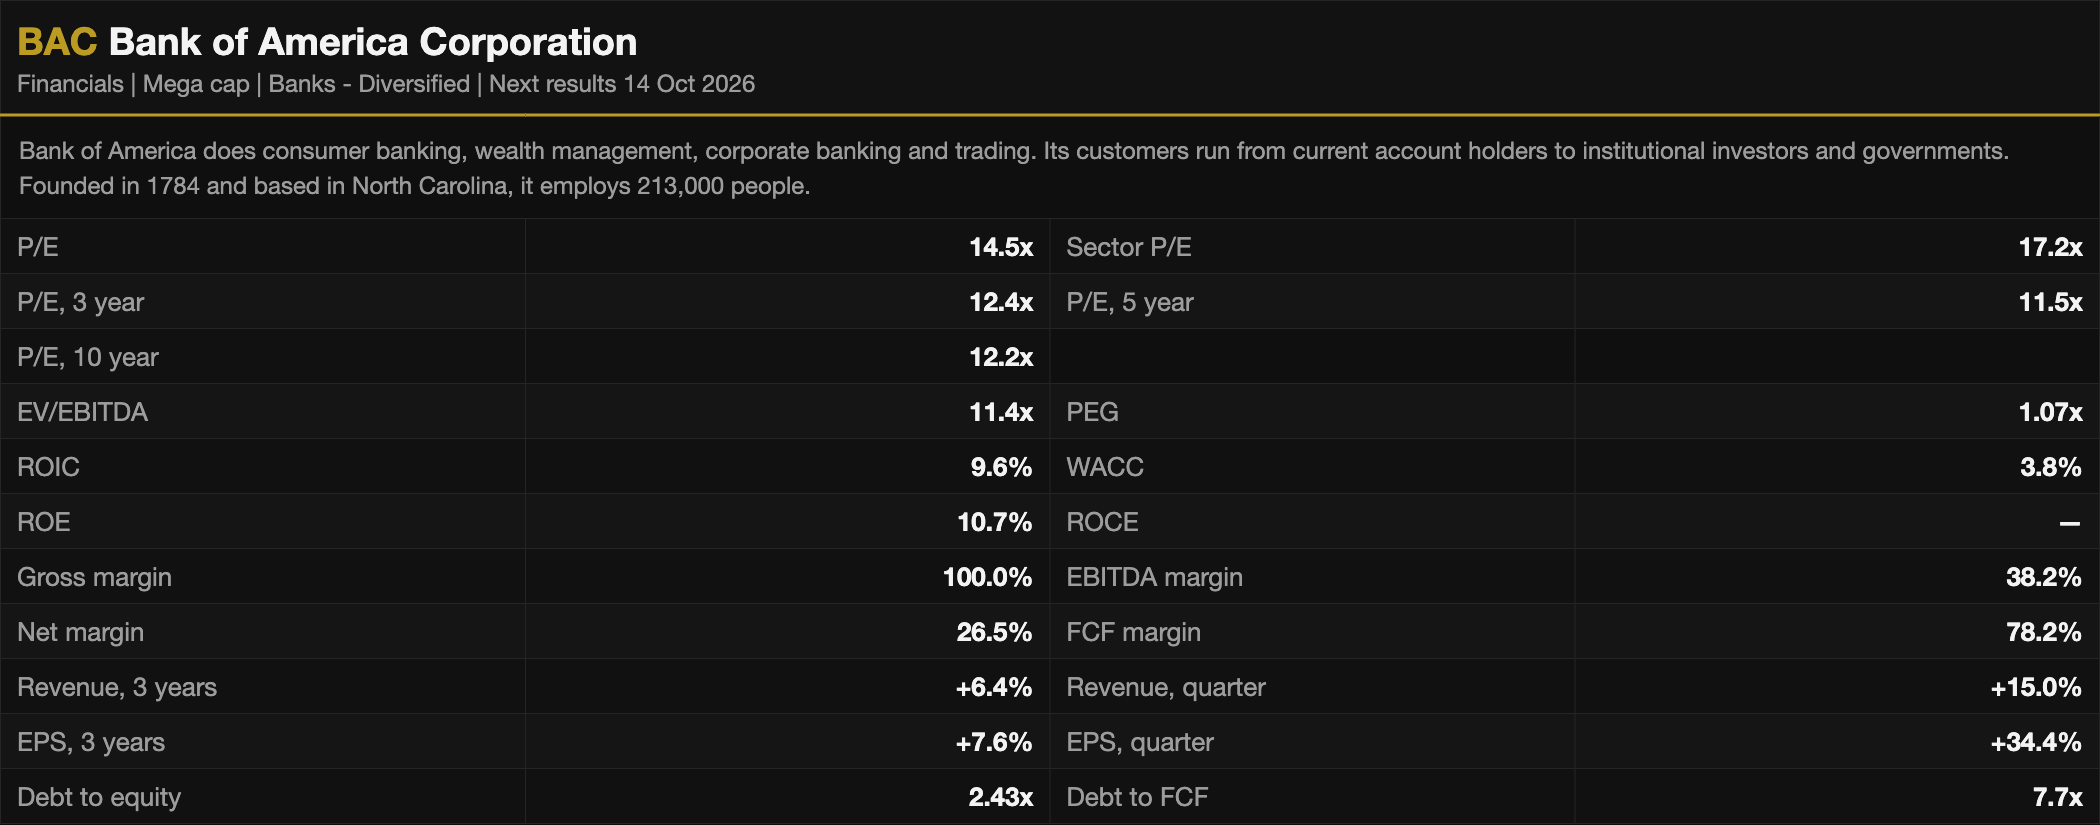
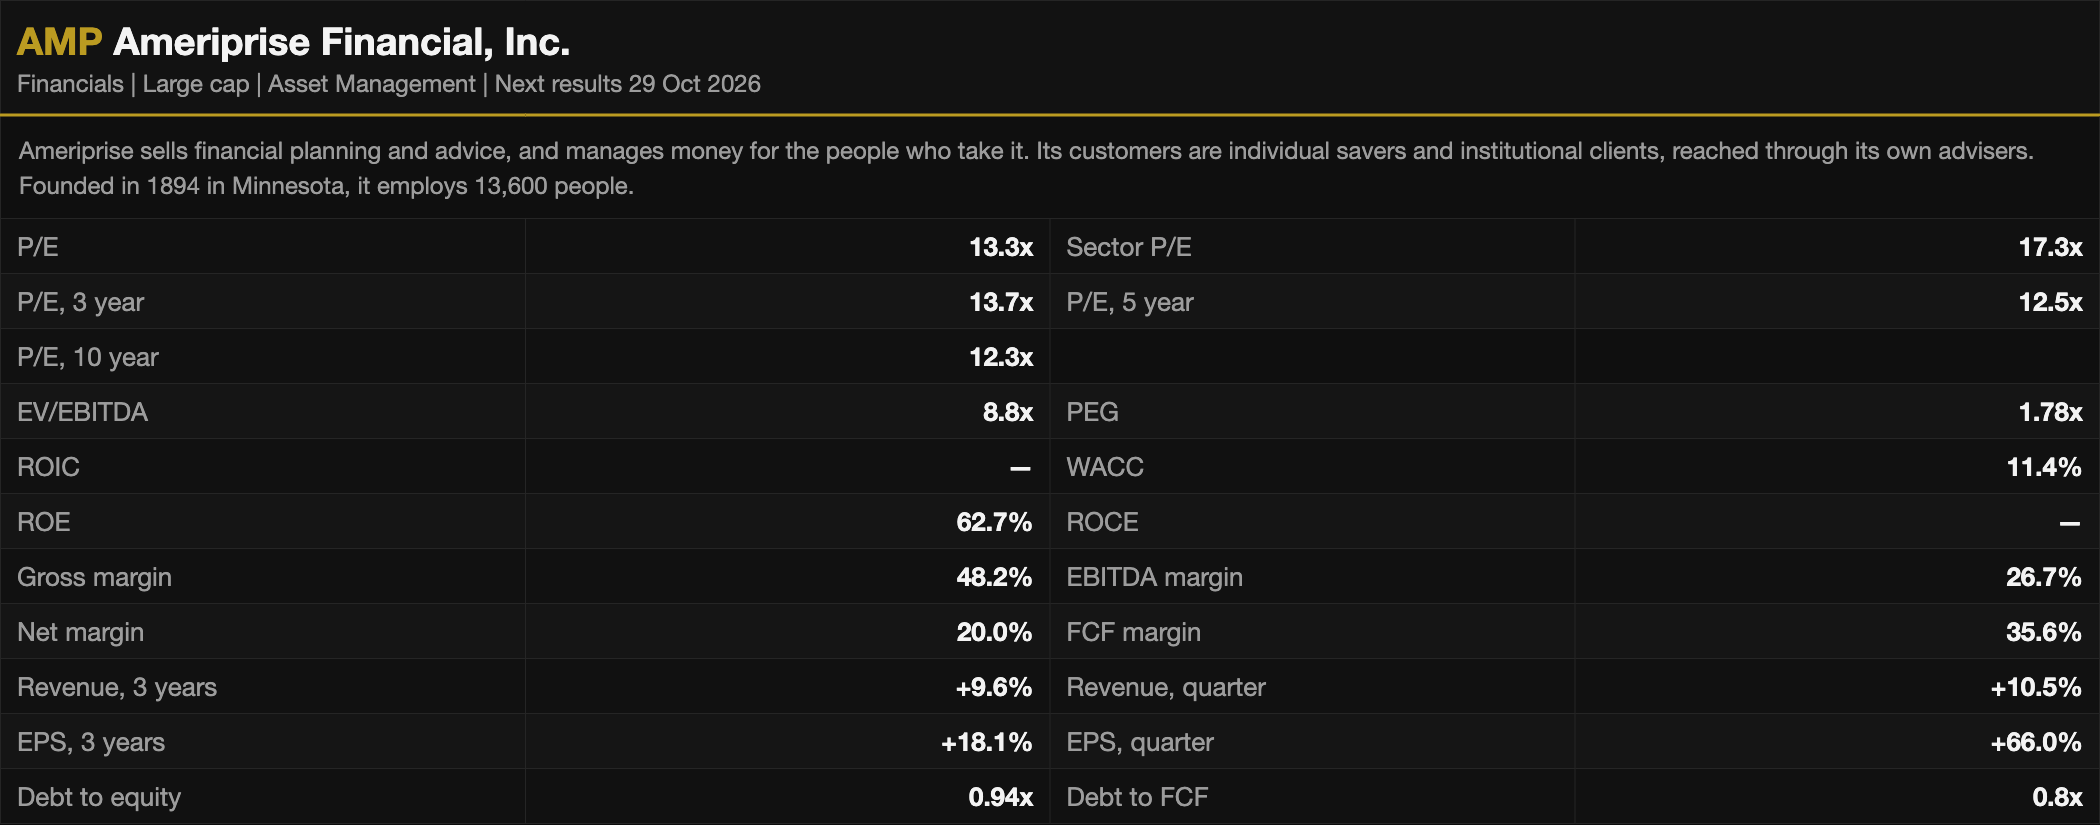
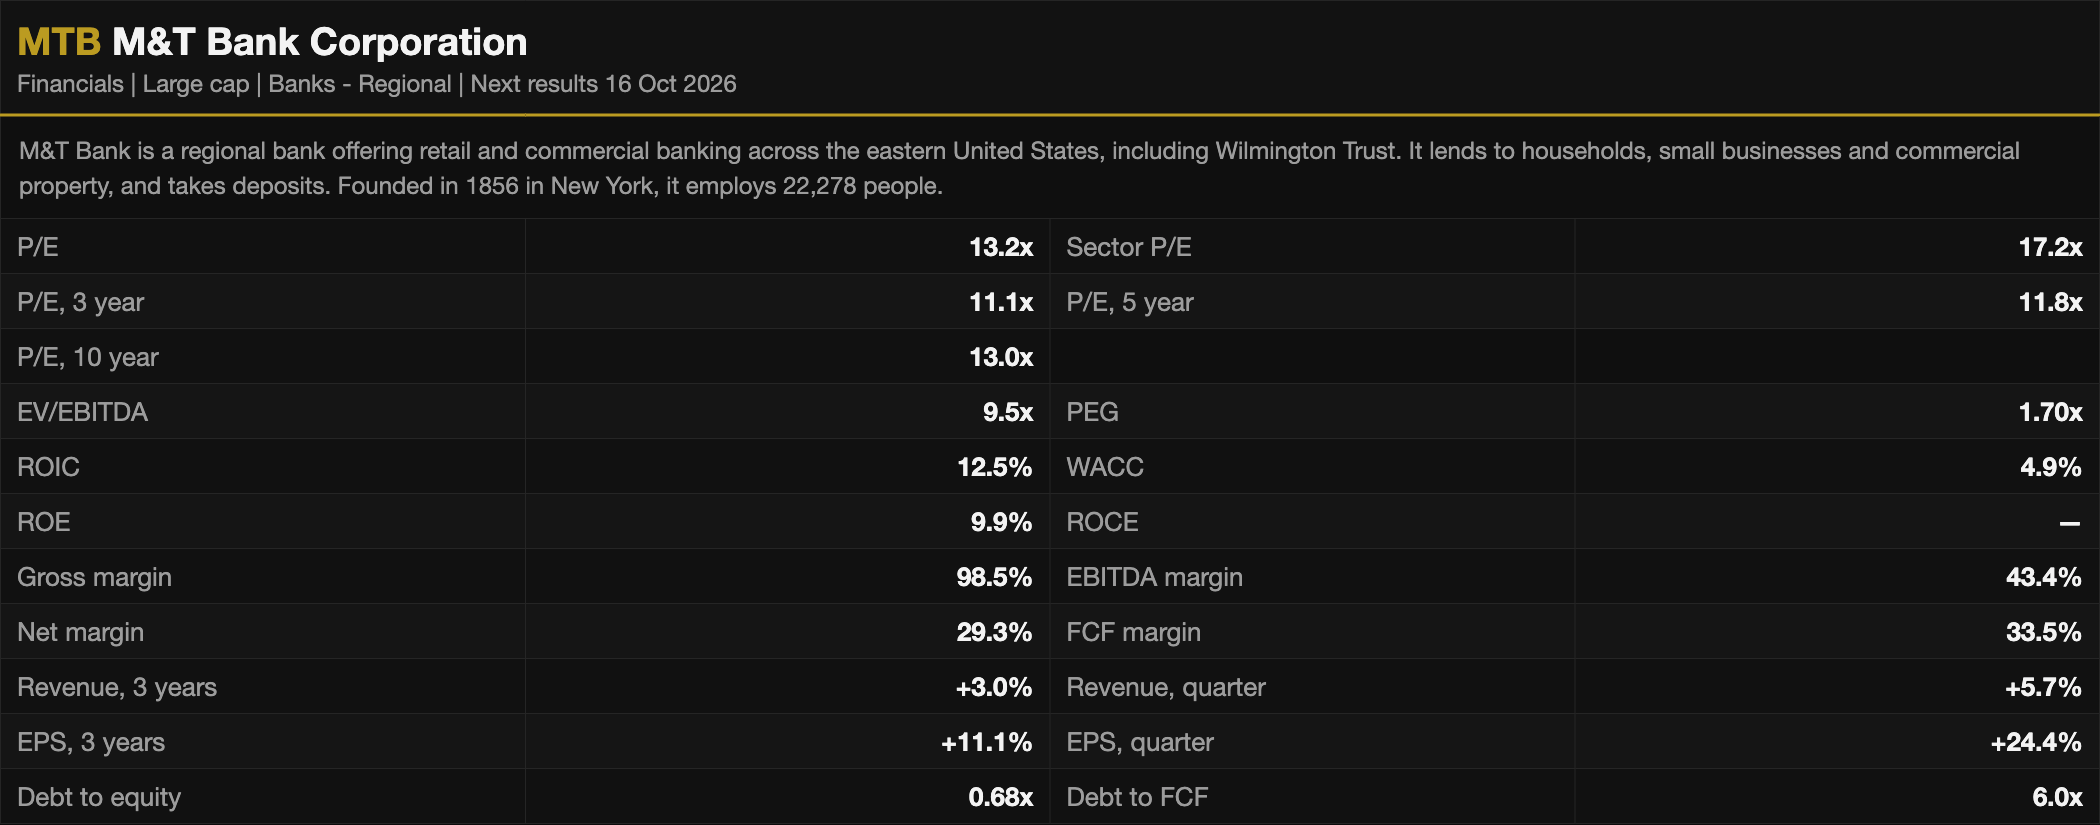
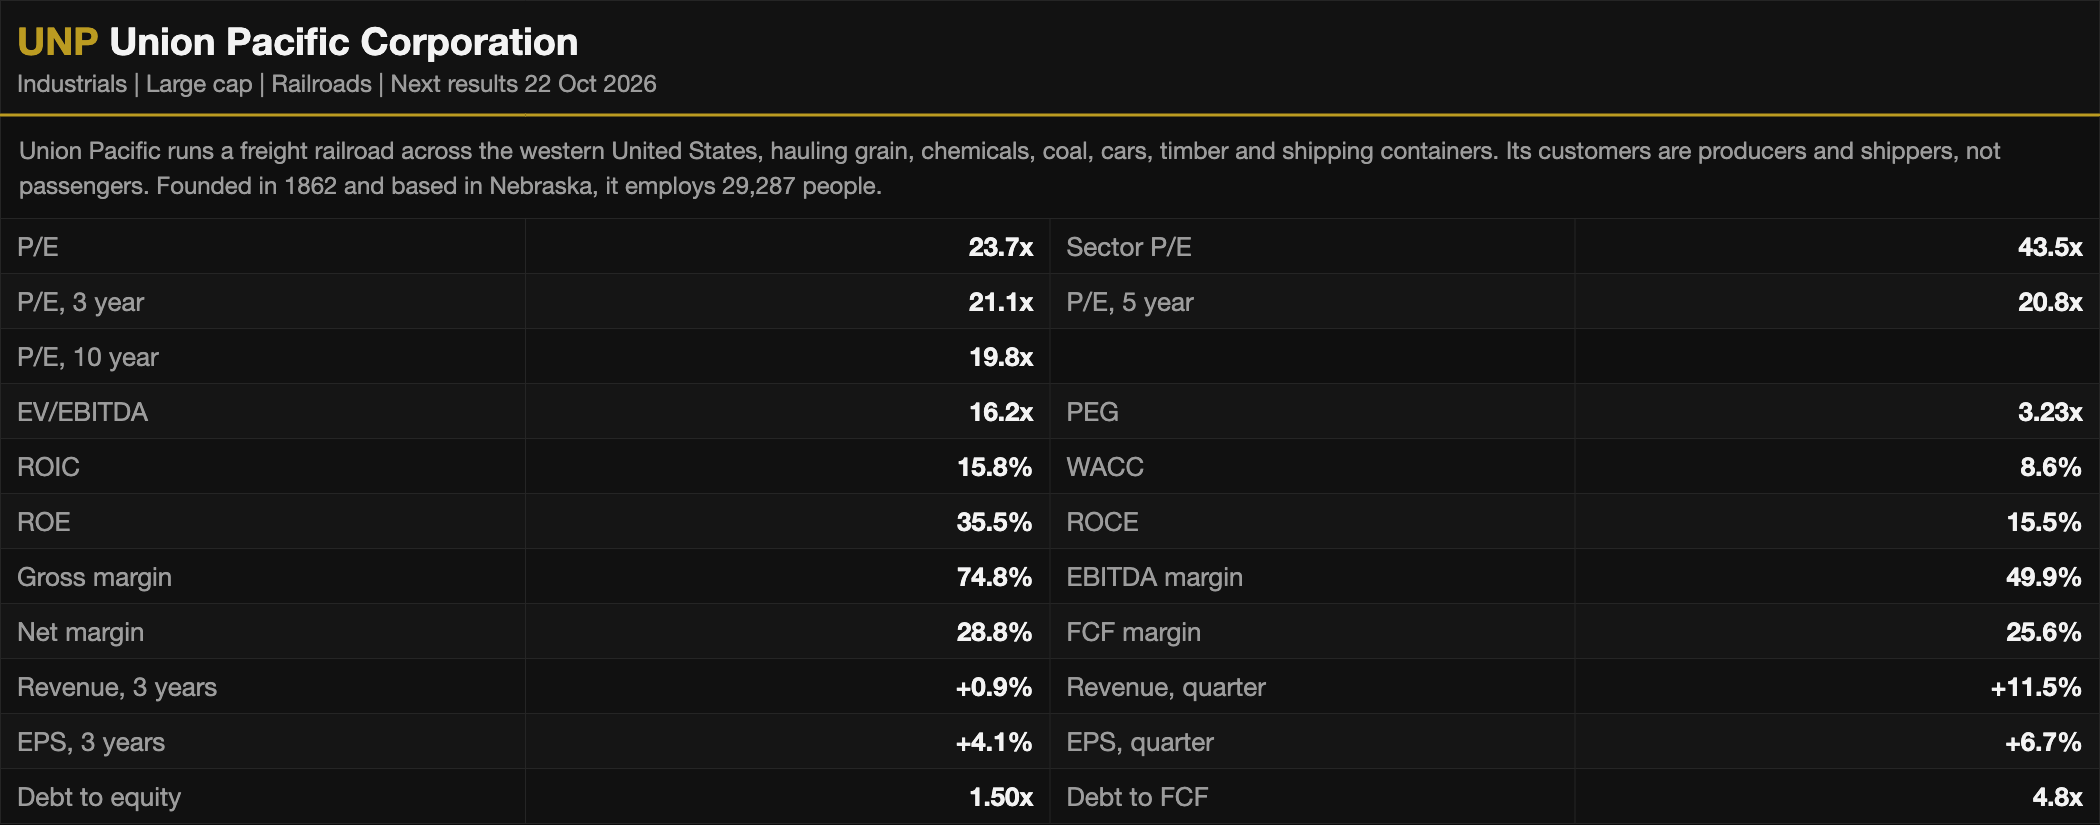
StockAnalysis.com is a wonderful tool and gives me every metric I want on each company. Every figure in the cards below comes from there.
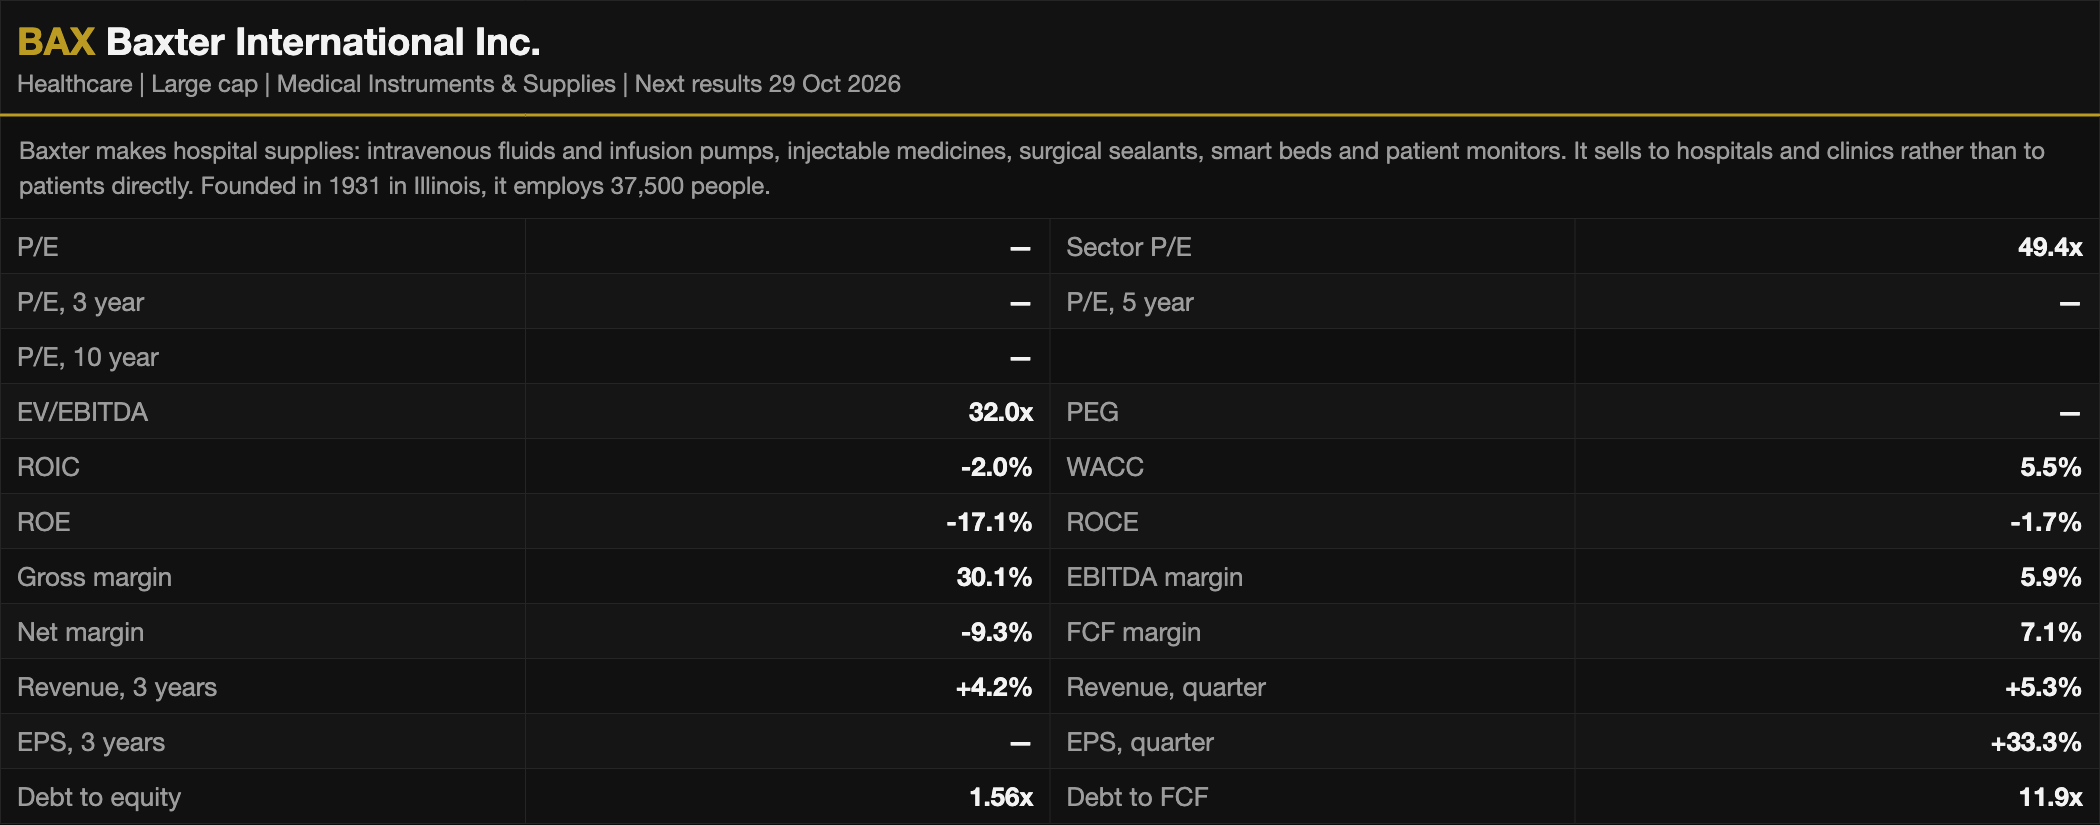
Data courtesy StockAnalysis.com
Data courtesy StockAnalysis.com
Data courtesy StockAnalysis.com
Data courtesy StockAnalysis.com
Data courtesy StockAnalysis.com
Data courtesy StockAnalysis.com
Data courtesy StockAnalysis.com
Data courtesy StockAnalysis.com
Data courtesy StockAnalysis.com
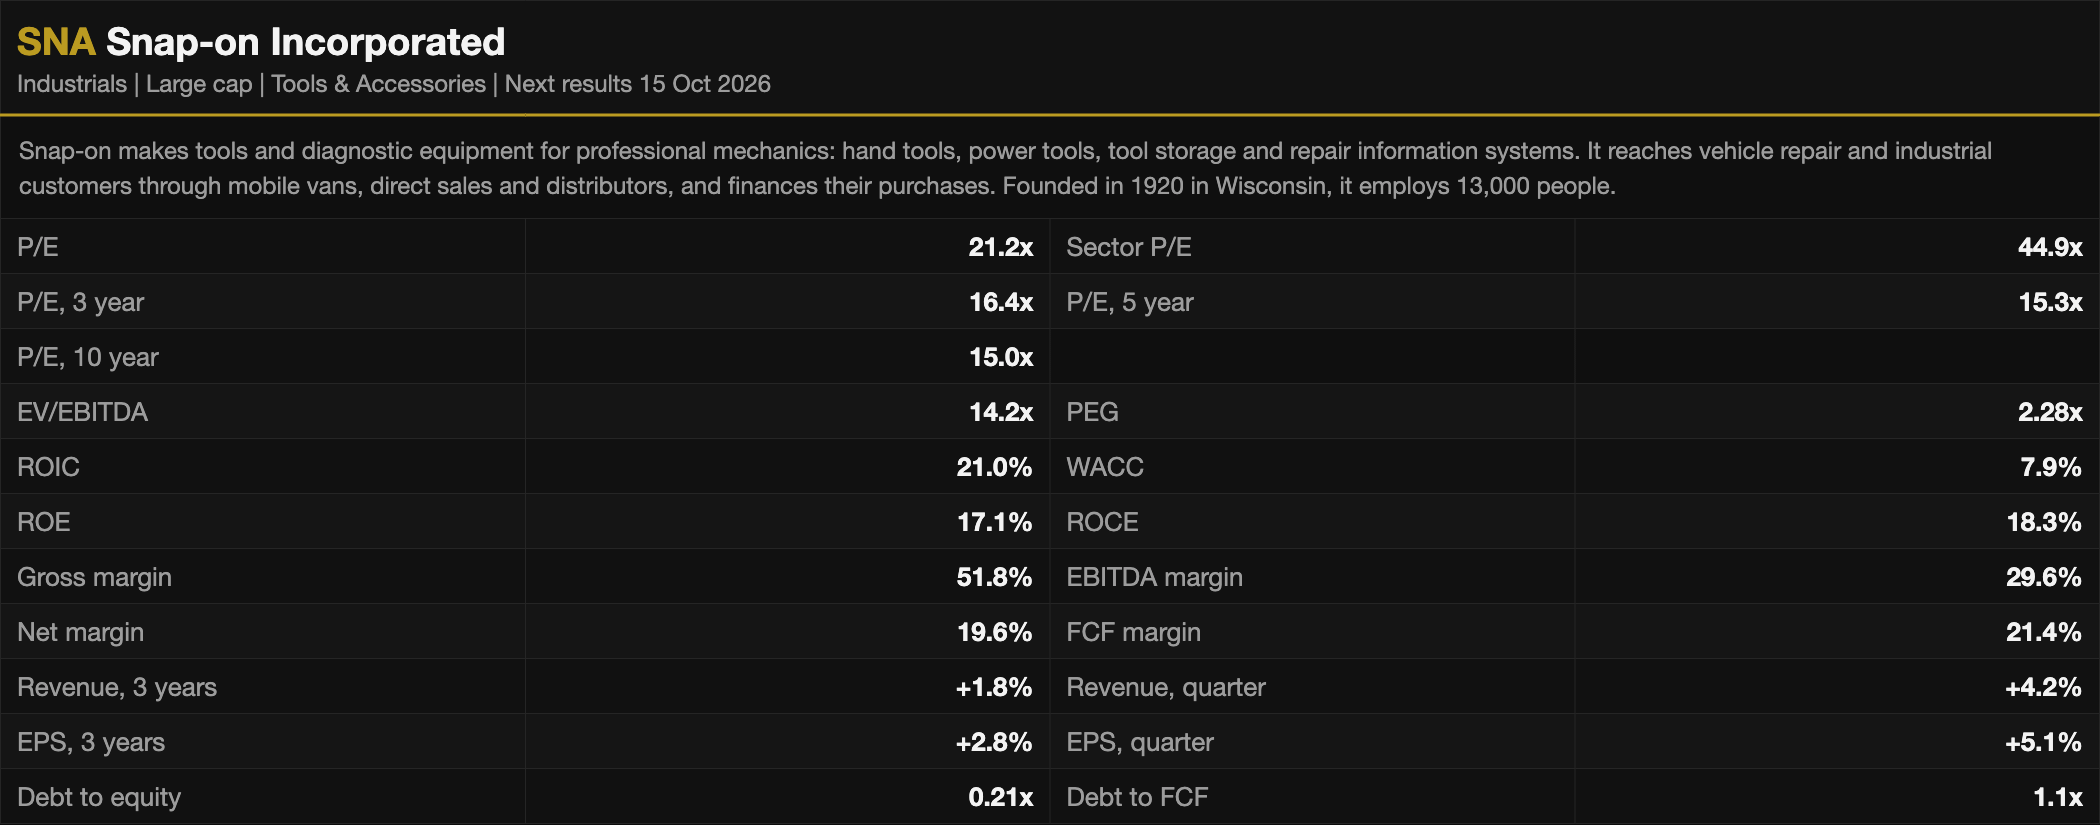
Data courtesy StockAnalysis.com
What this list is
My process is very simple. I start with the rotation graphs, on charts courtesy of StockCharts.com, and then I do a deep dive and apply my custom screen on the data from StockAnalysis.com. Each stat card tells its own story, but that is for the reader to study.
The chart and the full figures for everything named above:
Sectors
Industry funds
Companies
──
Join The Microcap Minute Global at 50% off for your first year.
To mark the launch, we're offering our first subscribers a special rate for the first year.

──
And that is all, folks. I will be back next issue.
Rgds
Ayush Agrawal
The Microcap Minute
──
Not advice or Recommendation. This is impersonal commentary published to a general audience, not personalised advice, and no reader is a client. Nothing here is a recommendation to buy, sell or hold any security, and there are no ratings, price targets or forecasts. It covers only securities listed on non-Indian exchanges. Full disclaimer, terms and privacy policy
Positions. The author does not hold any positions in the above companies at the time of writing. No position is opened or closed in a named company within 72 hours either side of publication. The author accepts no payment from any company covered, from any promoter, or from any investor relations firm.
Sources. Relative Rotation Graph and RRG are registered trademarks of RRG Research, used with permission. Charts are reproduced from StockCharts.com under their reprint permission policy. Every figure comes from StockAnalysis.com, whose affiliate programme the publisher participates in and may earn a commission from links in this issue, at no cost to the reader. Neither source has reviewed or endorsed the companies named here.