


This is a description of a business, not a view on its shares. Nothing here is a recommendation, and no target, rating or forecast appears anywhere in it. Sources are named at the end.
WHAT IT DOES
Travelers sells property and casualty insurance. Somebody pays a premium, and in exchange Travelers agrees to pay for a loss if one happens. The company holds the premium in the meantime and invests it, so it earns money twice: once on the difference between premiums taken in and claims paid out, and again on the returns from the pile of money it is sitting on while it waits.
That second part matters more than it looks. An insurer with poor underwriting can still make money if the investment returns are good enough, and an insurer with excellent underwriting can be sunk by a single year of catastrophes. The two have to be read together.
The business runs in three parts. Business Insurance covers companies against workers’ compensation claims, damage to commercial property and vehicles, and being sued. Bond and Specialty Insurance writes surety and fidelity bonds and covers directors and officers against claims made against them personally. Personal Insurance is car and home cover for households.
Those are the segment names in the accounts. The shelf a customer actually sees is wider: fourteen personal products, from the obvious car and home through renters, condo, boat, motorcycle, pet, travel, flood and wedding cover, and roughly ten commercial ones including cyber, surety and workers compensation. A company reporting one line called Personal Insurance and selling fourteen products under it is a broad consumer insurer, not a specialist, and only the product pages say so.
Data courtesy StockAnalysis.com
WHO BUYS IT, AND HOW THEY REACH THEM
Businesses, government bodies, associations and individuals, in the United States, Canada and internationally.
Almost none of it is sold directly. The company reaches customers through independent agents and brokers, agency aggregators, carrier-based agencies, and affinity partners, with some direct to consumer at the personal end. That distribution arrangement is the reason the agent relationship appears in the company’s own list of what it competes on, above price.
Within Business Insurance the customers are sorted by size: select accounts for small businesses, middle accounts for mid-sized ones, national accounts for large companies, and a national property group serving large customers, commercial trucking and agriculture.
The company’s own site names twenty five industries it writes cover for, among them agribusiness, construction, education, energy, financial institutions, food services, life sciences, manufacturing, marine, museums and fine art, nonprofits, oil and gas, public entities, real estate, technology and transportation. The filing describes the same customers as businesses, government units, associations and individuals, which is accurate and tells a reader nothing.
The distribution network has a size, and it is the number the filing leaves out. Travelers reaches customers through about 13,500 independent agents and brokers across the United States, Canada, the United Kingdom and Ireland. A competitor can match a price. Matching fifteen years of agency relationships is a different problem, and that is what a moat in this business actually looks like.
WHO IT COMPETES WITH
The company’s 2025 annual report cites A.M. Best putting roughly 1,100 property and casualty groups in the United States, made up of about 2,600 individual companies. The top 150 of those groups wrote about 94% of the industry’s net written premiums in 2024.
So the industry is enormously fragmented at the tail and heavily concentrated at the top, and Travelers is inside the top group. It also competes against self-insurance, where a large company simply carries its own risk through a captive insurer or a risk retention group rather than buying cover at all.
The company lists what it thinks it competes on, and the order is worth reading: the ability to price business profitably and keep customers, then premiums and contract terms, then agent and broker relationships, then keeping pace with technology including artificial intelligence, then the ability to use data and analytics to make decisions.
At least one of those has a headcount attached. The company says it employs more than 600 risk control consultants, whose work is helping a customer avoid the loss rather than paying for it after the fact. That is a service business bolted onto an insurance business, and it is the kind of thing that keeps a customer from moving for a slightly lower premium.
It is also, by its own account, the only property and casualty insurer in the Dow Jones Industrial Average.
Four of the five things the company names as competitive advantages are not visible in any financial statement. That is the argument for reading the filing rather than the ratios.
WHERE IT SITS AMONG THE COMPANIES IT COMPETES WITH
The fragmentation above is the backdrop. The foreground is a handful of large groups a Travelers customer might actually be quoted by instead, and lining them up next to each other says more than the word competitive does on its own.
Among listed American property and casualty insurers, Travelers is large but not the largest. By stock market value it is the third of its closest group, worth about 78 billion, behind Chubb at roughly 134 billion and Progressive at 123 billion, and ahead of Allstate at 66 billion and The Hartford at 38 billion. By premiums written it is fourth of those five. It is a heavyweight, not the heavyweight.
The number that matters most in this industry is the combined ratio, which is claims and expenses expressed as a percentage of premiums. Below 100 the underwriting made money before a penny of investment return. In 2025, a benign year for the whole group, Travelers ran 89.9%, and that was the highest of the five. Allstate came in at 84.9%, Chubb at about 85.7%, Progressive at 87.4% and The Hartford at 88.3%. On the single most important measure of underwriting, in a good year, Travelers was the least profitable of its closest listed peers.
That reads worse than it is, and the reason is what each company writes. Allstate and Progressive are mostly car insurance, which is short tail: a claim is filed and settled inside a year, so a rate rise reaches the numbers quickly and the ratio moves fast. Travelers and Chubb carry far more commercial and liability business, which is long tail, where the claim can arrive years after the premium and the money is held and invested in the meantime. A slightly higher combined ratio is the normal price of earning on that money for longer. Comparing the ratio alone rewards the short tail writer for the shape of its book, not for being better run.
On return on equity, the return the business earns on the shareholders’ money, the order flips. Travelers earned about 25% over the last year, ahead of The Hartford at 23% and Chubb at 14%, behind Progressive at 36% and Allstate at 41%. The car insurers earn more on their capital in a good year because their business turns over faster and ties up less of it. The same feature is what makes their bad years worse.
Then there are the competitors with no share price at all, and they are not the small ones. The largest property and casualty insurer in the United States is State Farm, a mutual owned by its policyholders, writing about 93 billion of premium, roughly twice Travelers. Liberty Mutual, Nationwide and USAA are mutuals too, and Berkshire Hathaway, through GEICO and its commercial lines, writes about 77 billion. A mutual answers to no stock market and need not earn a return every quarter, so in a soft market it can hold a low price longer than a listed company comfortably can. That is a real and permanent pressure on Travelers that nothing in its own accounts will show.
Globally the giants are European and Japanese, Allianz, AXA, Zurich and Tokio Marine, each larger overall than Travelers. But their American property and casualty footprint is a fraction of the whole. Zurich, the largest of them here, writes under 19 billion in the United States. Travelers competes almost entirely at home, against the domestic names above, and abroad it is the visitor rather than the host.
THE REGULATION IT LIVES INSIDE
Insurance in the United States is regulated state by state, not federally. The company’s domestic subsidiaries are licensed in all fifty states, the District of Columbia, Guam, Puerto Rico, the US Virgin Islands, American Samoa and the Northern Mariana Islands, and are regulated both where they are domiciled and everywhere they do business.
That is a genuine barrier to entry, and an unusual one, because it is made of paperwork rather than capital. A new entrant does not need a factory. It needs licences in fifty separate jurisdictions and the capital each one requires it to hold.
Its United Kingdom subsidiaries answer to the Prudential Regulation Authority and the Financial Conduct Authority, and it runs Syndicate 5000 at Lloyd’s through a managing agency that those two also regulate.
THE PEOPLE
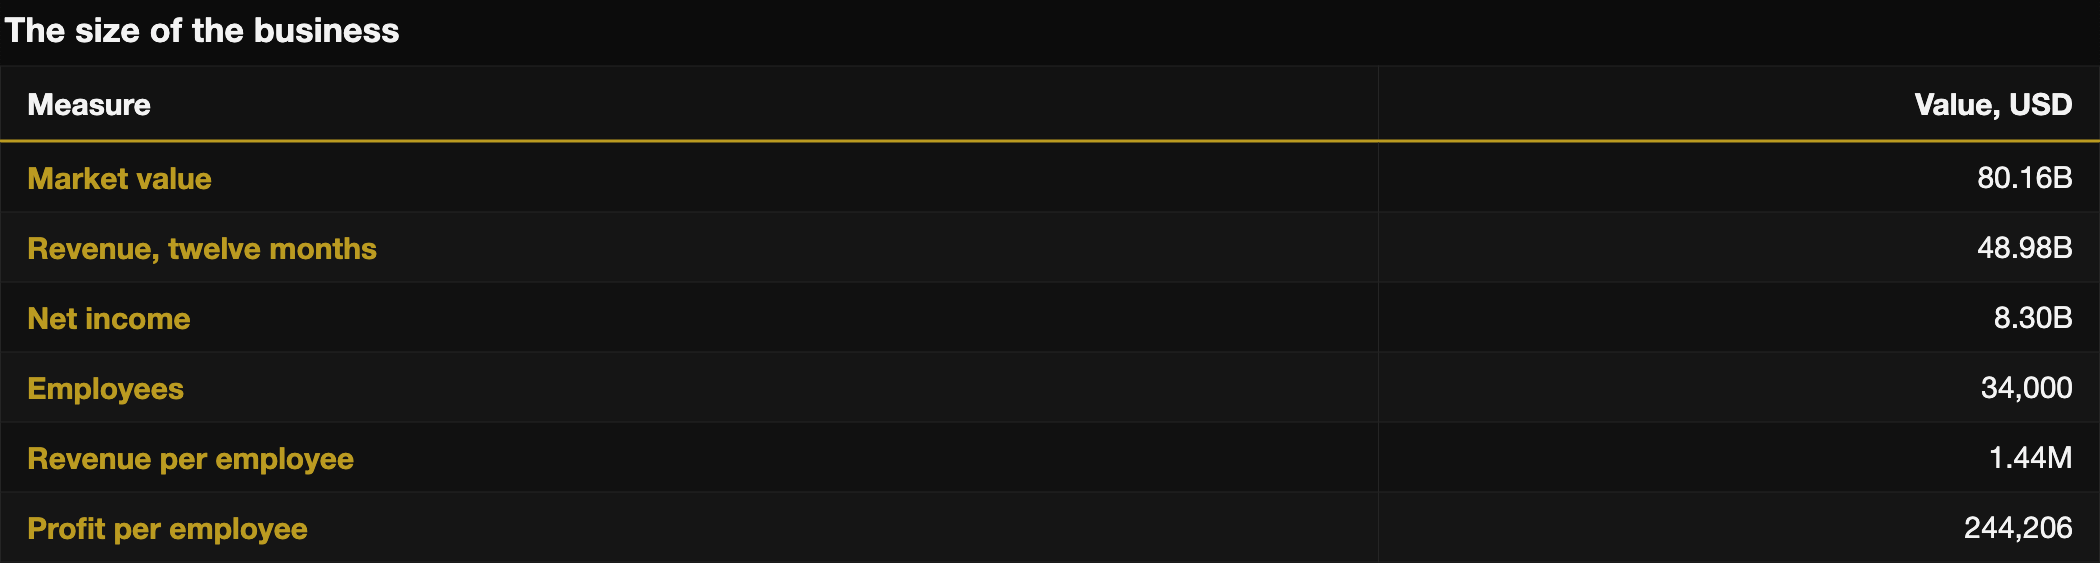
About 34,000 employees at the end of 2025, roughly 90% of them in the United States. Connecticut holds 22.6% of the total, then Minnesota at 6.8%, New York at 6.7% and Texas at 6.5%. Canada accounts for 5.3% and the United Kingdom 4.6%.
Headcount has grown slowly and steadily, from 30,600 in 2020 to 34,000 in 2024, and it did not move at all in 2025.
The company’s own website still says approximately 30,000, which was true several years ago. The figure used here is the one in the annual report, because a filing is signed and marketing copy is not. It is worth knowing which of a company’s public claims are current and which have simply not been revisited.
Alan Schnitzer is chairman and chief executive. Dan Frey is chief financial officer. The three segments each have their own president, and all three spoke on the most recent earnings call, which is unusual and tells you something about how the company presents itself.
WHAT THE NUMBERS SAY
Data courtesy StockAnalysis.com
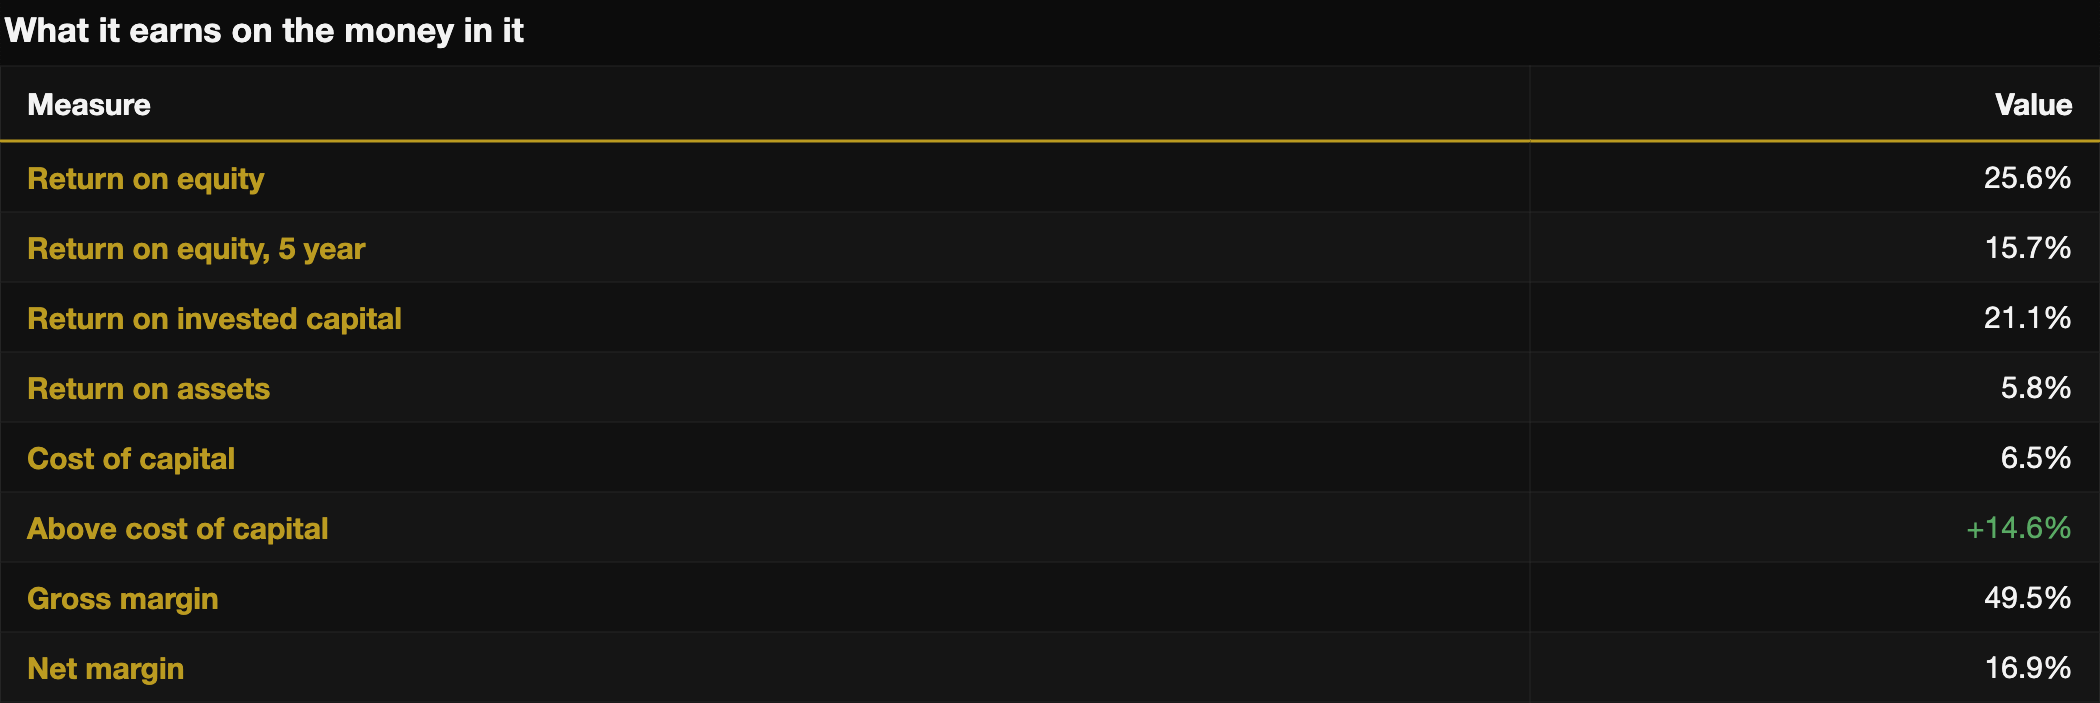
Return on equity is the figure to start with in an insurer, because equity is the buffer that lets it write business at all. Note the cost of capital beside it: the gap between what the business earns on its capital and what that capital costs is where value is either created or destroyed, and reading either number alone tells you nothing.
Gross margin is close to meaningless here. An insurer has no cost of goods sold in the sense a manufacturer does, so the figure is an artefact of how the statement is laid out rather than a fact about the business.
Data courtesy StockAnalysis.com
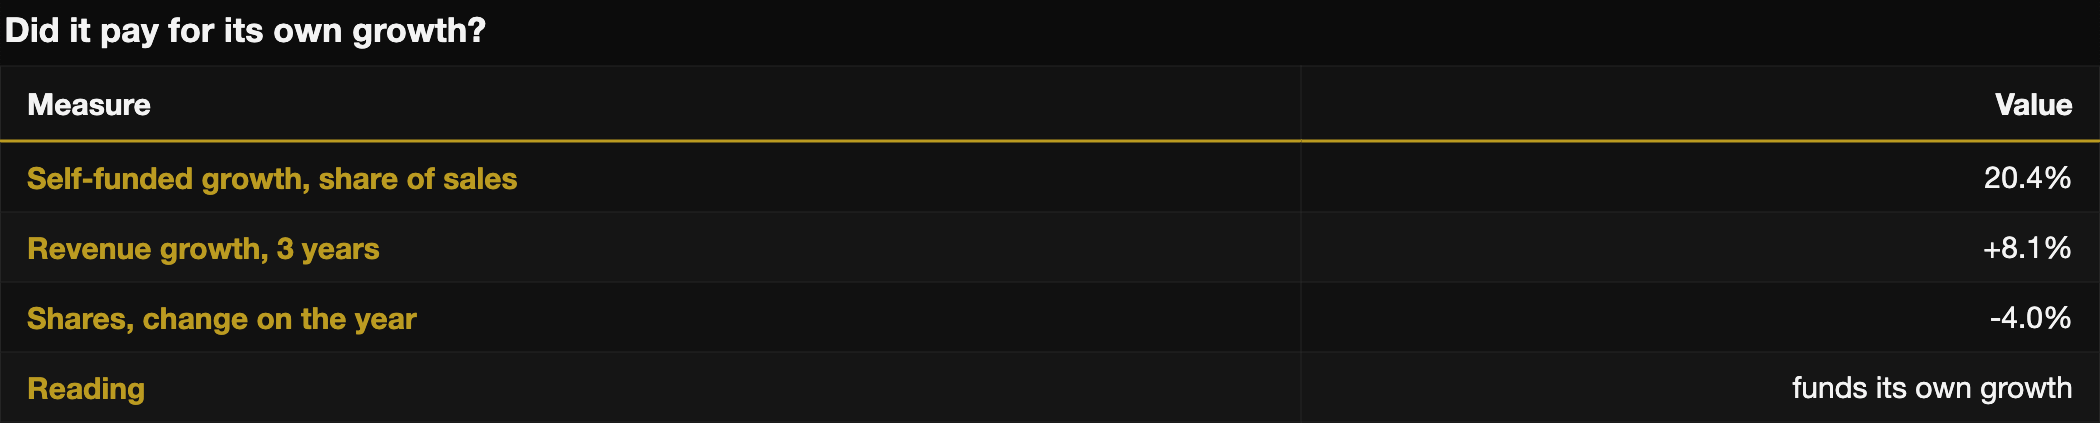
The Own Money Test asks the one thing a growth rate cannot: whether the growth was paid for out of the business or out of somebody else’s pocket. Read the reading, not the number on its own. An insurer scores high on this measure for a reason that has nothing to do with strength, because the cash flow line sweeps in premium and reserve movements, so the figure ranks insurers against each other and should not be read across to a manufacturer.
THE OTHER HALF OF THE BUSINESS, AND WHAT THE FLOAT EARNS
The opening said Travelers earns money twice, once on underwriting and once on investing the money it holds while it waits. It is worth putting the second half on the same footing as the first, because for this company the two are nearly the same size.
Travelers held 101 billion of investments at the end of 2025. Set that against 33 billion of its own equity, and the gap, about 68 billion, is other people’s money: premiums taken in but not yet paid out, and reserves held against claims already filed. Insurance people call it the float. Travelers invests it and keeps what it earns.
What it earns is deliberately dull, and that is the point. About 90% of the portfolio is bonds, 99% of them investment grade, and a third of the bond book is tax free municipal debt, which is why the company pays tax at 19% rather than the full 21%. This is not where an insurer is supposed to take its risk. The risk is in the underwriting; the investment book is meant to be safe and to compound, and this one is. Net investment income was 3.96 billion in 2025, and it has climbed every year, from 2.92 billion in 2023 to 3.59 billion in 2024, as maturing bonds were replaced at the higher interest rates of the last two years. Realised losses across the whole 101 billion portfolio were 48 million, which is a rounding error.
Now hold the two engines side by side. In 2025 the underwriting itself earned roughly 4.4 billion before tax, the ten cents left on every premium dollar by a combined ratio of 89.9%. The investment book earned 3.96 billion. Neither is a sideshow. A company that underwrites at a modest profit and invests a growing float is running two businesses of comparable size, and reading only one of them, in either direction, gets it half wrong.
WHAT FIVE YEARS OF NUMBERS ACTUALLY SAY
One year of anything is an anecdote. Five is an argument, and here the five years say something the single year does not.
Net income was 2.8 billion in 2022 and 6.29 billion in 2025. Over roughly the same span total assets went from about 116 billion to 144 billion, a quarter more. Earnings more than doubled off the 2022 trough while the balance sheet grew by a quarter, and the trailing twelve months to the middle of 2026 have since reached about 8.2 billion as a strong first half of the year was added. Whatever produced that, it was not deploying more capital. It was getting more out of the capital already there, which is the same thing the gap over cost of capital reports in a single figure. The segment numbers below say exactly where the improvement came from, and it is not spread evenly across the company.
The second thing is subtler and it is the check most people run backwards. The usual worry about any set of accounts is profit with no cash behind it, because that is what an aggressive accounting policy produces. Travelers has the opposite, every year:
In 2023 operating cash was 2.58 times net income. In 2024 it was 1.82 times. In 2025, 1.69 times. Operating cash flow itself rose every year, from 7.7 billion to 9.1 billion to 10.6 billion.
An insurer will always show more cash than profit, because premiums arrive before claims are paid. What matters is the direction. That multiple has narrowed steadily, and it narrowed because profit rose to meet the cash rather than because cash weakened: the cash kept climbing in absolute terms the whole way down. A multiple falling for that reason says the underwriting got better. Had it fallen because cash was drying up, it would say the opposite, and it would say it years before the earnings did.
A ratio moving is worth more than a ratio being high. This one moving toward parity says the underwriting got better. Had it moved the other way it would say the opposite, and it would say it years before the earnings did.
WHICH PART OF THE COMPANY ACTUALLY EARNS THE MONEY
The three segments are not thirds of anything, and the story of the last three years is almost entirely in one of them. In 2025 Business Insurance earned 3.70 billion of segment income, Personal Insurance 2.05 billion, and Bond and Specialty 0.95 billion.
Business Insurance, the commercial book, is the biggest and the steadiest. It earned 2.58 billion in 2023, 3.31 billion in 2024 and 3.70 billion in 2025, on a combined ratio that improved gently from 94.7% to 91.7%. This is the ballast, and it barely wavers.
Bond and Specialty is the smallest and the odd one, and the most profitable per dollar of premium. It writes surety bonds and cover for directors and officers, and its numbers look unlike an insurer’s: a very low loss ratio of 43%, because these losses are rare, paid for with a very high expense ratio of 39%, because the business is expensive to acquire and underwrite. It earned around 0.8 to 0.95 billion in each of the three years, hardly moving, at a combined ratio in the low 80s. It is a quality annuity bolted to the side of the company.
Personal Insurance, the car and home book, is where everything happened. In 2023 it lost 128 million, at a combined ratio of 104.8%, meaning it paid out more than it took in. Home and car insurers across the country were underwater that year as repair and rebuild costs ran ahead of the rates regulators had approved. Travelers pushed rates through, the claims environment eased, and the segment earned 1.25 billion in 2024 and 2.05 billion in 2025, at a combined ratio back down to 89.5%. That swing, from a 128 million loss to a 2.05 billion profit, is about 2.2 billion, and it is most of the reason the company’s total earnings more than doubled over the same stretch.
The single year hides this and the segments reveal it. Travelers did not become 2.2 billion better at insurance in general. One of its three businesses went from losing money to earning a normal margin, in step with the whole personal lines industry, and that alone moved the group. Whether it holds is a question about the rate cycle staying where it is, not about how well the company is run.
WHERE THE MONEY WENT
Share buybacks, and increasingly so. In 2022 the company spent 1.0 billion buying back its own shares, which was 13% of the cash its operations produced. In 2023, 1.1 billion and 12%. In 2024 it stepped up to 3.1 billion and 30%. Last year it spent 5.5 billion, or 50%.
By last year half of every dollar of operating cash was going into shrinking the share count, which is down four percent on the year. That is a statement from management, and it is a coherent one: a business that cannot usefully reinvest more capital and is earning well above its cost of capital should hand the money back rather than find something to spend it on.
The honest qualification is that the shares rose about 44% over the last year, so the largest buyback of the five came at the highest prices of the five. Buying back stock is only value creating below what the business is worth, and nothing here establishes what that is.
ONE NUMBER MOVING THE WRONG WAY
Receivables grew 10.0% last year while premiums grew 4.0%. As a share of premiums they went from 66.3% to 70.2%.
For most companies, receivables outrunning sales is the classic warning that revenue is being manufactured by extending credit. For an insurer it is milder, because these are mostly premiums due from policyholders and agents rather than goods pushed at a distributor, and a shift in when policies are written moves it. It is four points on a business with 144 billion of assets.
It is recorded here because it is the one line in five years of statements that moved against the grain of everything else, and because a document that only reports the figures pointing one way is not worth reading.
WHETHER THE RESERVES ARE HONEST
An insurer’s profit is an opinion until the claims are paid, because the largest number on its books is an estimate: the reserve set aside today for claims it will pay out over years to come. Set it too low and this year’s profit has been borrowed from a future write down. The way to check the opinion is to watch what happens to old reserves as the real claims arrive.
When a past year’s reserve turns out to have been more than enough, the excess is released back into profit, and this is called favourable development. When it turns out too small, the shortfall is charged against current profit, which is adverse development. A company that is favourable year after year has been setting its reserves conservatively. Travelers has been favourable in each of the last three years: 143 million released in 2023, 709 million in 2024 and just over 1.04 billion in 2025. Reserves set in the past have, on the whole, proved more than enough.
The honest detail is buried inside the 2023 figure. That year’s 143 million was barely positive, and underneath it the commercial liability book actually developed adversely by 289 million: claims from earlier years came in higher than reserved, and only favourable movements in the other segments covered it. It is the one recent sign that the longest tail part of the book, the liability claims that take years to surface, can still catch the reserve setters out. The two later years were cleanly favourable across all three segments, but the 2023 blemish belongs in a deep dive precisely because the headline number swallowed it.
WHAT ACTUALLY LIMITS HOW MUCH IT CAN WRITE
Travelers spends essentially nothing on capital equipment. On the usual reading that makes it an asset light business, and asset light businesses are supposed to be easy to enter, because nobody has to build a factory. That reading is wrong here, and working out why is most of the way to understanding the company.
The constraint is capital, just not the kind that shows up as capital spending. An insurer cannot write more business than its own capital supports. Each insurance subsidiary is regulated as a separate legal entity with its own capital requirement, and since 2023 the group has also had to file a calculation covering the whole of itself rather than each piece. Cash cannot simply be moved up from the subsidiaries to the parent either: above a threshold that needs a regulator’s permission first.
So growth is not funded by deciding to grow. It is funded by capital that regulators have agreed may be counted, sitting in the right legal entity, and released upward only with permission.
Sitting on top of that is a second gate that is easy to miss. Four rating agencies publish a claims-paying rating, which is their view of whether the company can meet its promises. That rating is not just a cost of borrowing. Some customers will not do business at all with an insurer below a minimum rating, so it functions as a licence to compete for part of the market. A downgrade would not merely make funding dearer; it would remove access to business the company is otherwise perfectly able to write.
Put the two together and the barrier to entry is clearer than any moat story. A competitor needs regulatory capital in fifty jurisdictions, a rating from agencies that will not give one to a newcomer with no claims history, and an agency network built over years. None of that is capital spending, which is why the capital spending line reads zero and why reading it as asset light would be exactly backwards.
HOW LONG THE ADVANTAGE LASTS
A moat has two dimensions and the figures above only measure one of them. Depth is how much a business earns over the cost of the money in it, and Travelers shows just under fifteen points of it. Width is how long it can keep doing that, and no ratio reports width at all.
The evidence here points to a long one, and it is unusually concrete for this kind of judgement. A new entrant does not need a factory, it needs licences in more than fifty separate jurisdictions and the capital each one demands. It needs a network of agents built over years, and this one is about 13,500 strong. It is competing against a firm that has been writing policies since 1853.
There is a further point about who is actually locked in, and it is easy to get backwards. A household changes home insurer in twenty minutes and does it for a small saving. The customer has almost no switching cost at all. The agent does: a book of business, an appointment with the carrier, systems wired together, years of commission history. The stickiness in this business sits one step back from the customer, with the 13,500 intermediaries rather than with the millions of policyholders. That is why the company lists agent and broker relationships above technology in what it competes on, and it is why the size of that network is the number worth knowing.
Set against that, the company’s own account of what it competes on in its middle market business is ease and speed of doing business, and price. Those are not durable advantages. They are the parts a well funded competitor can attack next quarter, and they sit inside the same filing as the licences and the agency network.
The useful question is not whether there is a moat but how long it holds. Licences and agency relationships erode over decades. Ease of doing business erodes in a product cycle. A reader deciding what to make of this business is really deciding which of those two is doing the work.
WHETHER THE PEOPLE RUNNING IT OWN ANY OF IT
Insiders hold about half a percent of the company. That is normal for a business of this age and size and it is not a criticism, but it is worth stating plainly rather than leaving a reader to assume more.
The structure behind it is more interesting than the number. Non-employee directors take more than half their pay in deferred stock units that are not handed over until at least six months after they leave the board. A director who votes for something that flatters this year and costs the company in three still owns the consequence when it arrives.
Data courtesy StockAnalysis.com
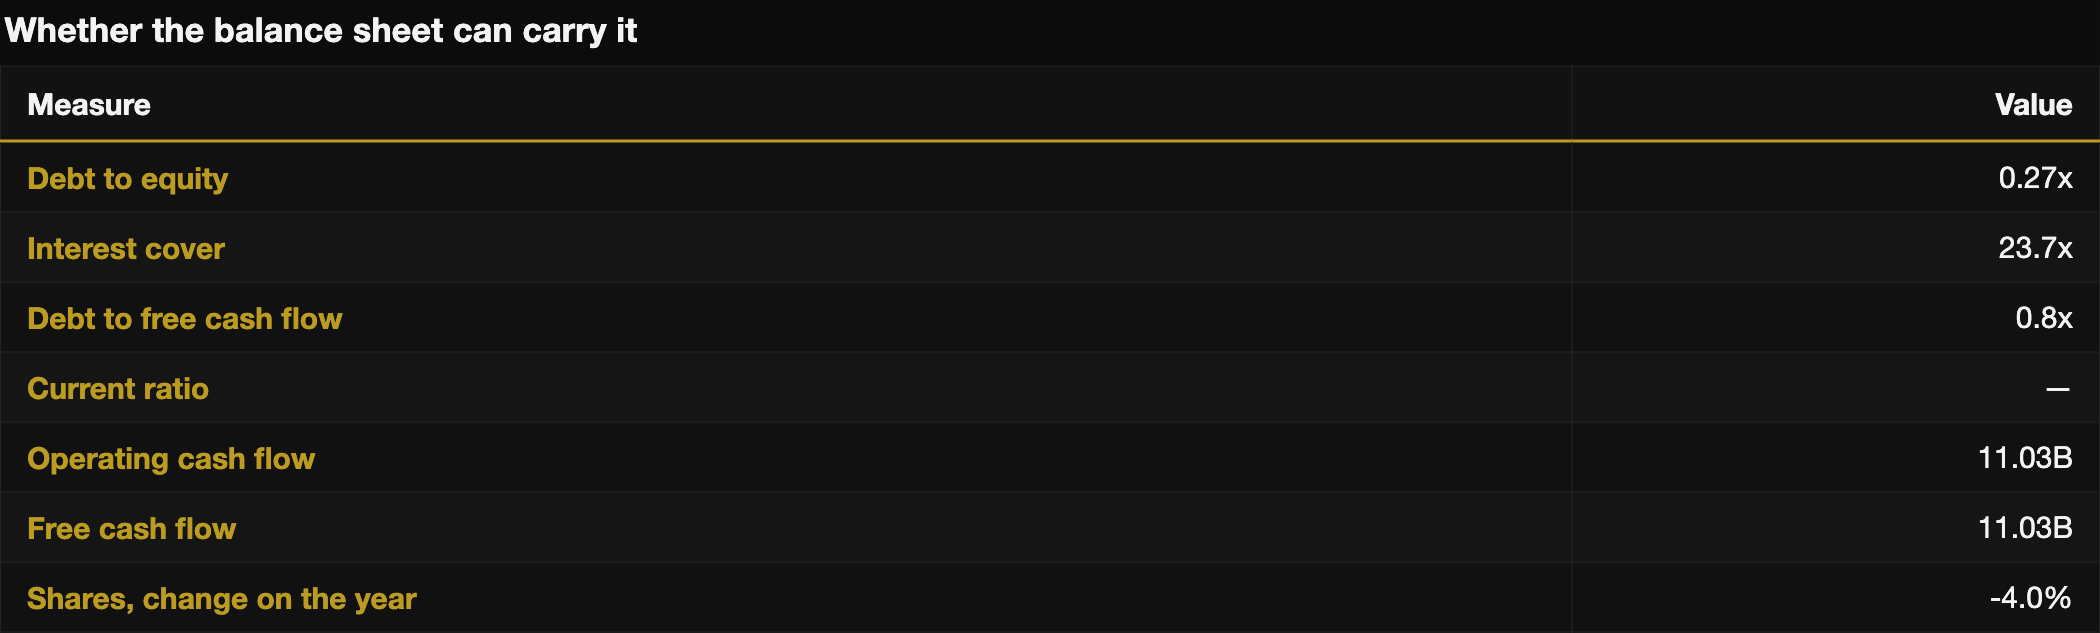
Interest cover is the one to watch. It answers whether the debt is a problem now, which debt to equity does not.
Data courtesy StockAnalysis.com
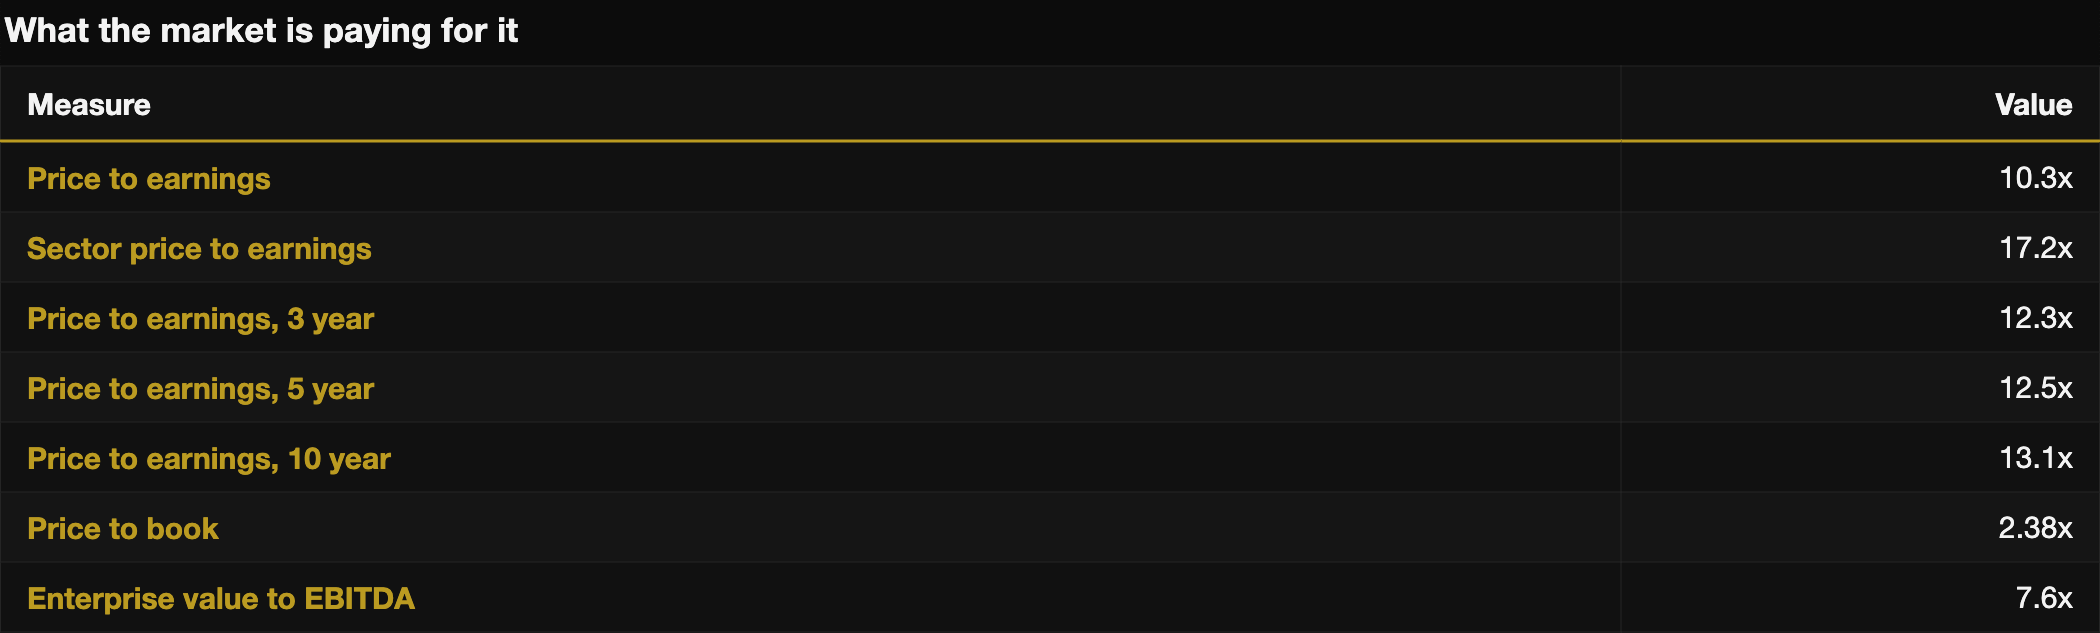
The three historical price to earnings figures are averages, so they cannot produce a range. What they show is direction: whether the market is paying more or less for the same earnings than it used to.
WHAT MANAGEMENT SAID LAST
On the second quarter 2026 call, reported 17 July 2026, the company said core income was $2.2 billion with a core return on equity of 24.9%, the combined ratio improved to 83.6%, retention was 86%, and new business was a record $805 million, up 8% on the same quarter a year earlier. Renewal price change excluding property was 7.8% and roughly flat on the previous quarter. Over $1.5 billion was returned to shareholders in the quarter.
A combined ratio below 100 means the underwriting itself made money before any investment return, which is the thing an insurer is supposed to do and frequently does not.
WHAT WOULD HAVE TO GO WRONG
Two things in the filing are more specific than the usual list, and both are structural rather than bad luck.
The first is reinsurance. Travelers lays off part of its risk to other insurers, which is what lets it write large policies at all, but those treaties carry aggregate limits and caps. In a year with several large losses the cover can be used up, and what remains sits on Travelers’ own balance sheet. The protection is real and it is not unlimited, and the year you find out is the year you least want to.
The second is that it cannot always reprice. In states with prior approval rules, a rate has to be cleared by the regulator before it can be charged. When claims costs move faster than approvals do, the gap is carried by the insurer, and no amount of underwriting skill closes it.
Beyond those, the ordinary ones apply: catastrophe losses in a bad year, reserves set aside for claims turning out too small, and investment losses on the money held between premium and claim.
The structural question is simpler than any of them. This is a business whose product is a promise about the future, priced today on an estimate of what that promise will cost. Everything else follows from whether that estimate is right.
And this folks was how we will structure each week’s deep dive for our Premium Newsletter every Wednesday.
If you are interested in becoming a paid subscriber, you can avail the limited time discount on annual membership.
Additionally, now you can also pay by UPI. Use the Coupon Code FIRST100 when paying via UPI
WHERE ALL THIS CAME FROM
Figures are from StockAnalysis.com and each table is derived from there.
The business description, the competitive position, the industry concentration, the regulatory position and the employee distribution are from the company’s own annual report on Form 10-K for the year ended 31 December 2025, filed with the Securities and Exchange Commission on 12 February 2026. Management’s remarks are from the second quarter 2026 earnings call of 17 July 2026. Both are public documents and can be read in full.
The reinsurance limits, the rate approval position and the competitive factors are from the same annual report. Insider holdings and the director pay structure are from the proxy statement filed 7 April 2026. The product range, the list of industries covered, the size of the agency network and the risk control headcount are from the company’s own website, travelers.com. No text or image from that site is reproduced here.
The segment results and combined ratios, the net investment income and portfolio figures, the reserve development history and the year by year net income and operating cash flow are from the same 2025 annual report, with the 2022 net income figure taken from the prior year’s Form 10-K filed 13 February 2025. In the peer comparison, the market values, revenues and returns on equity for Chubb, Progressive, Allstate and The Hartford are from StockAnalysis.com; the full year 2025 combined ratios are from each company’s own results announcements; and the premium rankings, including the mutual insurers with no listed shares, are from published 2025 industry data.
Nothing in this document is a recommendation to buy, sell or hold any security. The author holds no position in the company named. Full disclaimer, terms and privacy policy are on the publication’s policy pages.